


 525 692

[(Fig._2)TD$FIG]
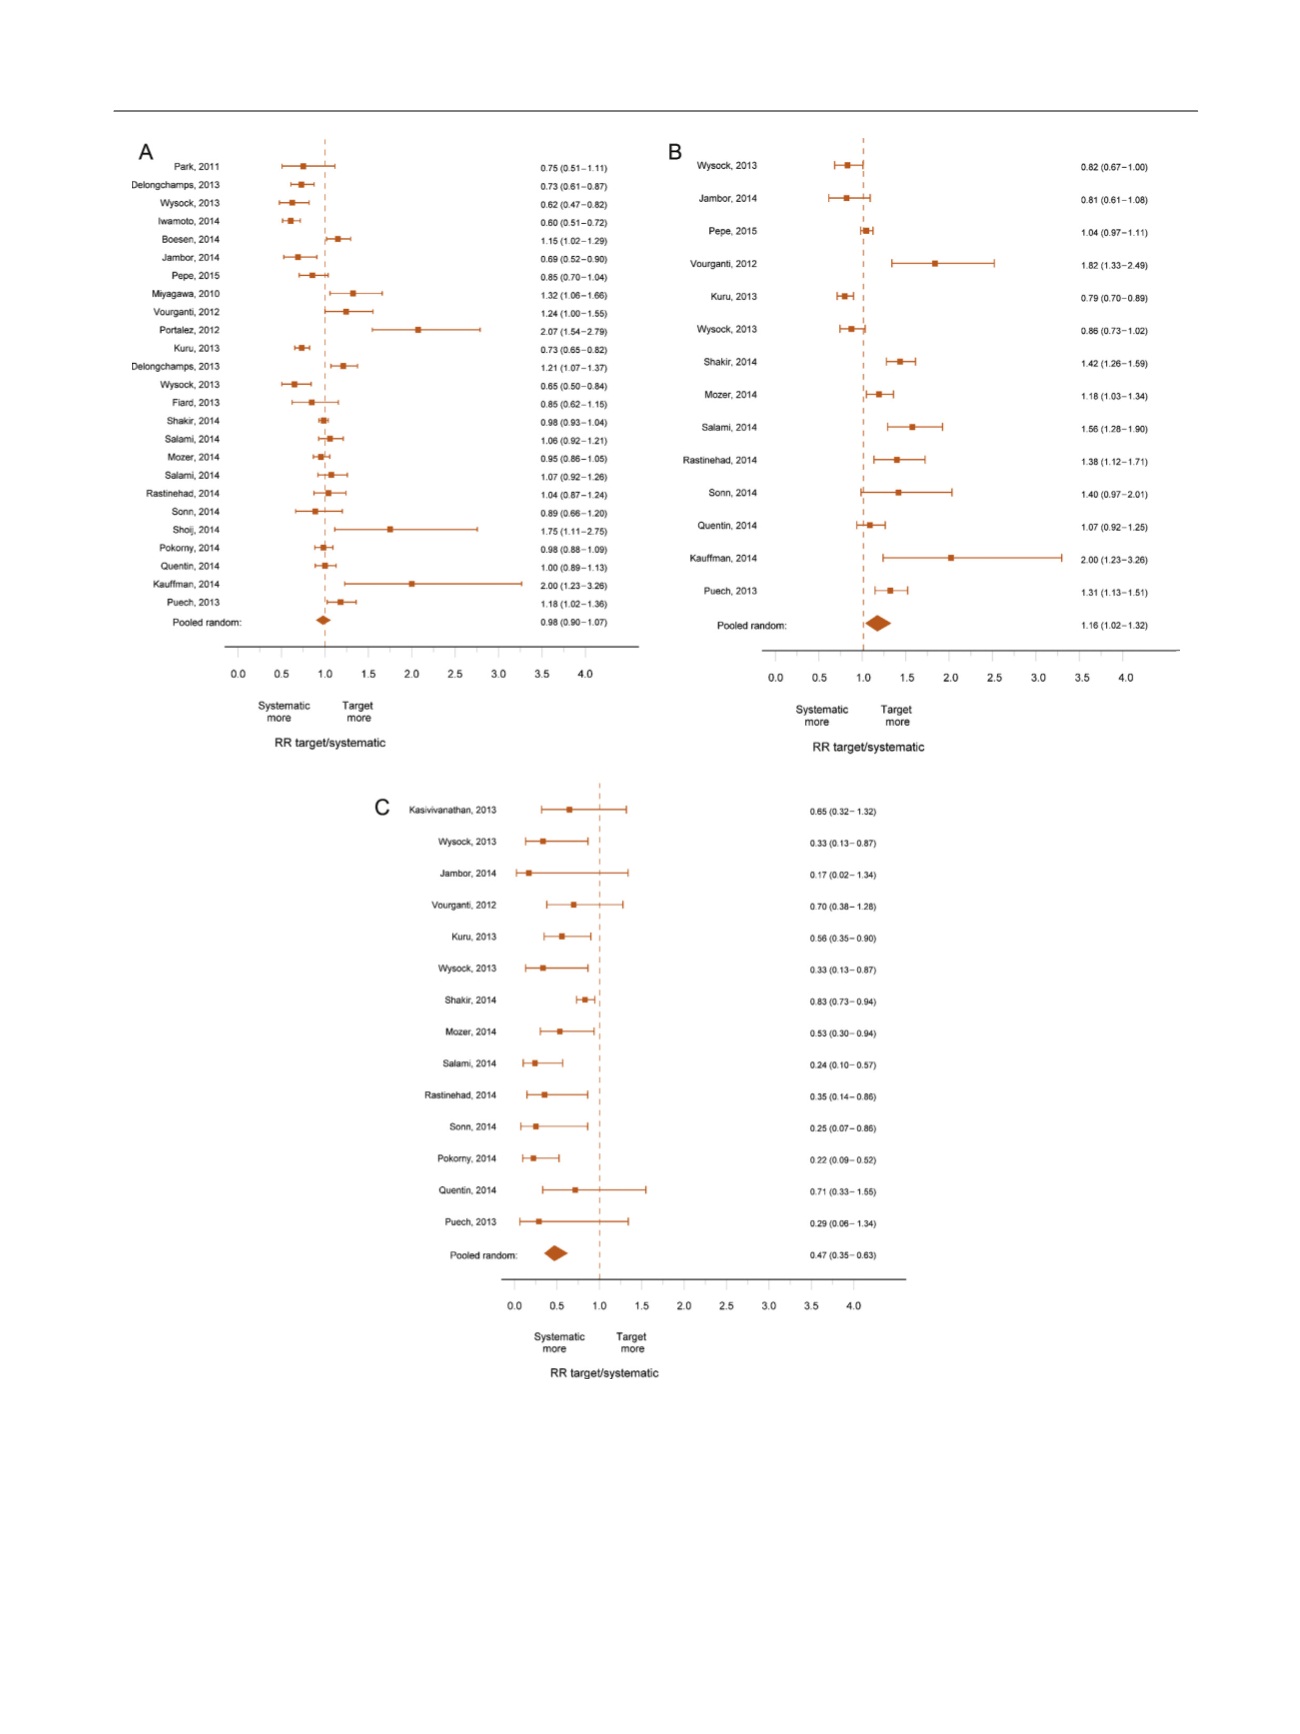
Fig. 2 – (A) Forest plot of pooled relative sensitivity of MRI-guided biopsy (MRI-GB) and transrectal ultrasound-guided biopsy (TRUS-GB) for all prostate
cancer (PCa); (B) forest plots of pooled relative sensitivity of MRI-GB and TRUS-GB for clinically significant PCa; (C) forest plots of pooled relative yield
of MRI-GB and TRUS-GB for insignificant PCa.
RR = relative risk.
E U R O P E A N U R O L O G Y 7 1 ( 2 0 1 7 ) 5 1 7 – 5 3 1
525