


 520 692

(
n
= 17) had a high risk of bias, and 7% (
n
= 3) had an
intermediate risk of bias.
Regarding the applicability to the current review 65%
(
n
= 28) had low concerns on applicability, and 35% (
n
= 15)
had high concerns. Causes for concerns regarding applica-
bility and bias included whether TRUS-GB was performed in
conjunction to MRI-GB, whether the operator of TRUS-GB
was blinded for MRI results, the number of TRUS-GB cores
taken, what radiological threshold was applied to perform
MRI-GB, and the population investigated. Of the 43 included
studies 35% (
n
= 15) had both a low risk of bias and low
concerns regarding the applicability.
3.3.
Population
The 43 included studies demonstrate significant variation in
cohort size, ranging from 16 to 1003 (median, 106) patients.
The mean PSA value ranged from 5.1 ng/ml to 15.3 ng/ml
and the mean age ranged from 61.8 yr to 70.0 yr. The
populations varied with respect to biopsy history. For all
subsequent analysis, we used clinical homogenous data on
detection rates among patients with no or negative prior
biopsies.
A 3-T scanner was used in 72% (
n
= 31) of the included
studies. Of the included studies 58% (
n
= 25) applied
PI-RADS classification for the evaluation of the mpMRI.
The above-mentioned heterogeneity in the evaluation and
reporting of imaging is reflected by the variation of
thresholds applied for performing a targeted biopsy.
Of the included studies 21% (
n
= 9) performed MRI-GB
exclusively, whilst 79% (
n
= 34) combined it with TRUS-GB.
Most studies applied a single technique of targeting,
although four studies used both COG-TB and FUS-TB within
the same population.
Finally, considerable heterogeneity was found with
respect to the applied definition of csPCa. Therefore we
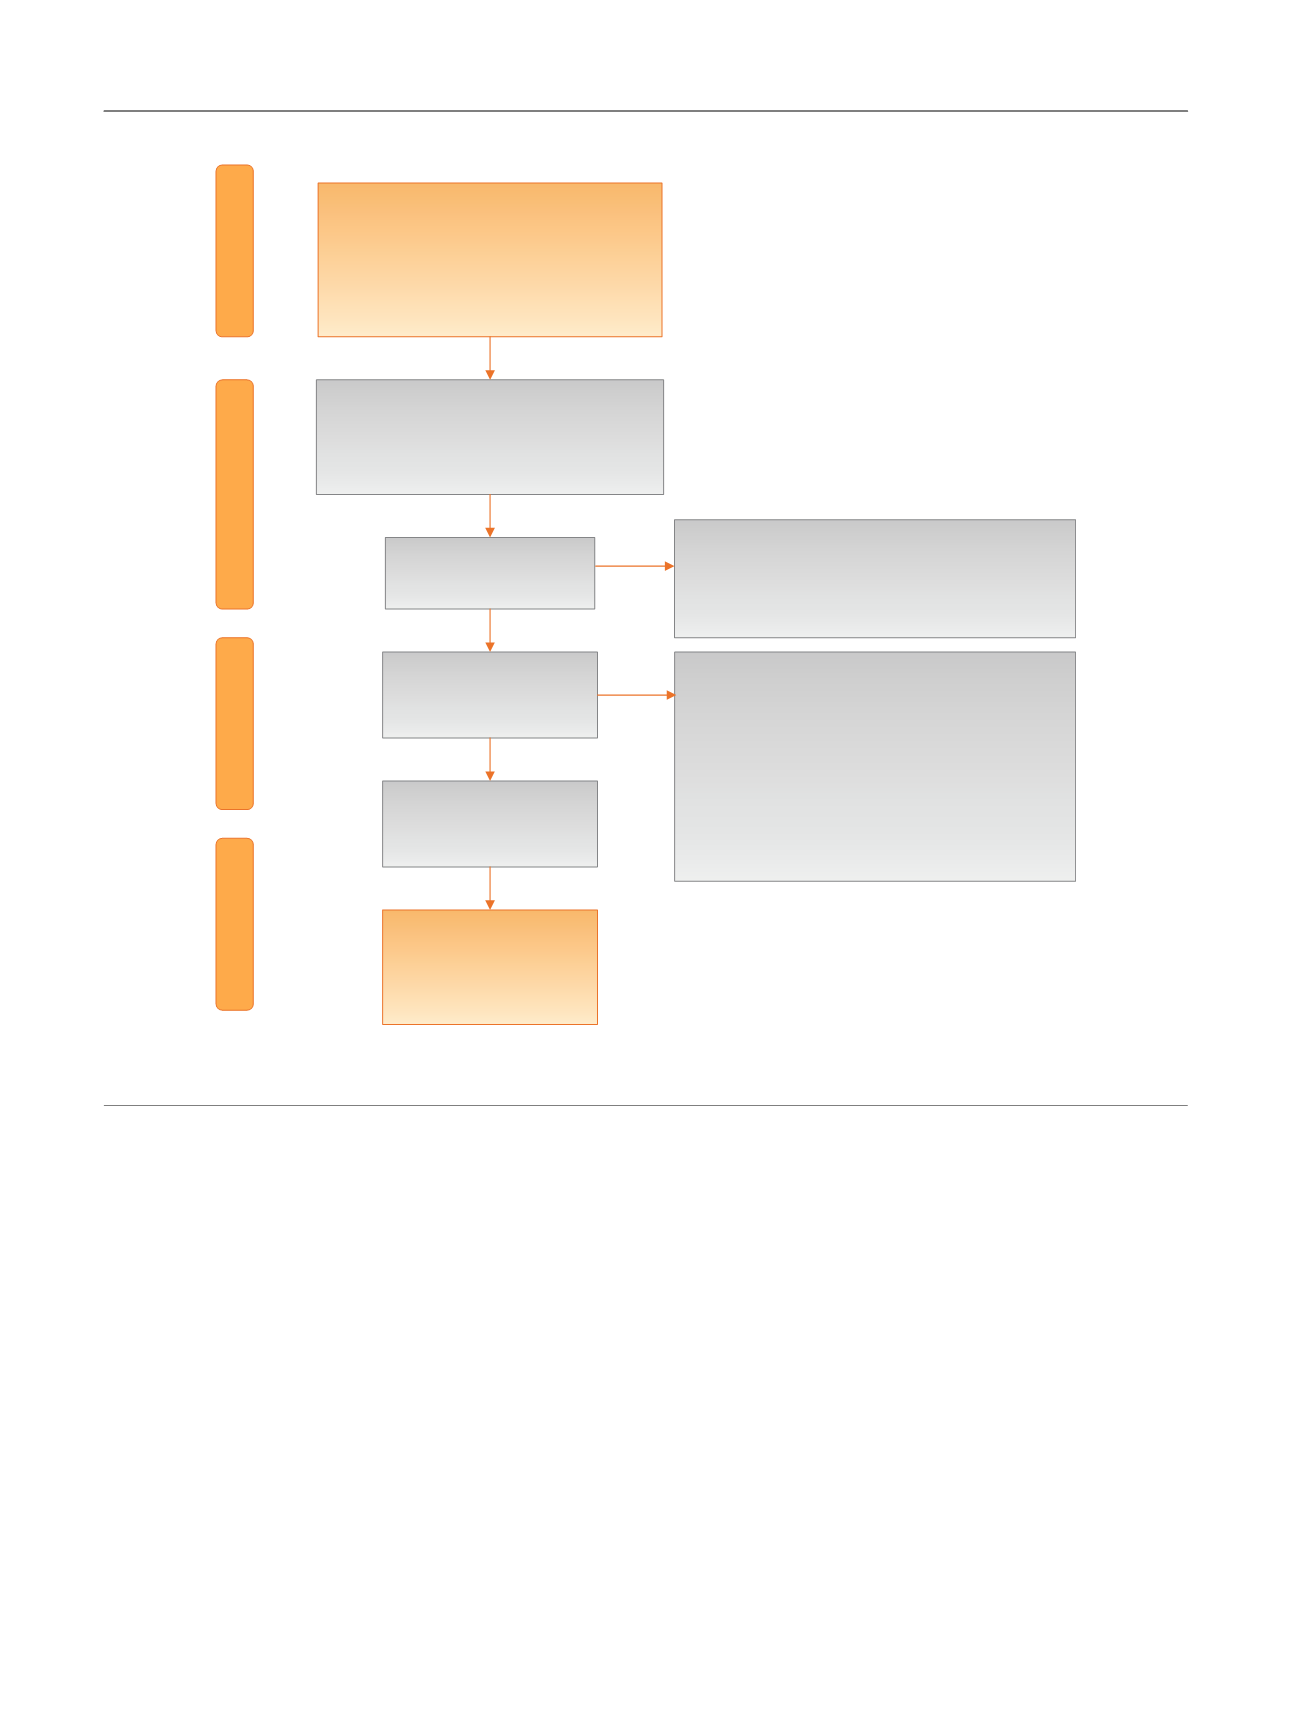
[(Fig._1)TD$FIG]
Search date: October 27, 2014
Records idenƟfied through database
searching
Total
n
= 2562
(Embase
n
= 1378
PubMed
n
= 1138
CENTRAL
n
= 46)
Screening
Included
Eligibility
IdenƟficaƟon
Records aŌer duplicates removed
Total
n
= 1734
(exact duplicates
n
= 491
close duplicates
n
= 337)
Unique records screened
(
n
=
1734
)
Records excluded (
n
= 1632)
•
n
= 1556 not relevant to review quesƟon
•
n
= 15 purely acƟve surveillance populaƟon
•
n
= 61 image acquisiƟon not according to ESUR
Full-text arƟcles assessed
for eligibility
(
n
= 102)
Full-text arƟcles excluded (
n
= 59 )
•
n
= 24 populaƟon not fiƫng review quesƟon
•
n
= 8 no English text available
•
n
= 7 imaging not according to ESUR
•
n
= 6 alteraƟve intervenƟon used
•
n
= 5 study design not fiƫng review quesƟon
•
n
= 4 publicaƟon of idenƟcal data
•
n
= 4 outcomes reported not fiƫng review quesƟon
•
n
= 1 not relevant for review quesƟon
Studies included in
qualitaƟve synthesis
(
n
= 43)
(
n
= 43)
Studies included in
quanƟtaƟve synthesis
(meta-analysis)
Fig. 1 – Preferred Reporting Items for Systematic Reviews and Meta-analysis (PRISMA) flow chart.
ESUR = European Society of Urogenital Radiology.
E U R O P E A N U R O L O G Y 7 1 ( 2 0 1 7 ) 5 1 7 – 5 3 1
520