


 608 692

determined using the Newcastle-Ottawa Scale (NOS) for
nonrandomized controlled trials
( www.ohri.ca/programs/ clinical_epidemiology/oxford.asp ). A total score of 5 or less
was considered low, 6–7 was considered intermediate, and
8–9, high quality.
2.4.
Data analysis
Data were extracted using a predefined data extraction
form. Baseline demographics (age, tumor size, baseline
renal function, baseline CKD), perioperative data (opera-
tive time, estimated blood loss, complications, surgical
margins, hospital stay, and pathology, for which we used
the term
malignant histology
to define any nonbenign
histology), and functional (postoperative renal function,
postoperative CKD, decline in estimated glomerular filtra-
tion rate [eGFR]) and oncologic (tumor recurrence, cancer-
specific mortality, and all-cause mortality) outcome
parameters were extracted from the studies whenever
available.
A formal meta-analysis of studies comparing PN to RN
for both cT1b and cT2 tumors was conducted (primary
endpoint). In addition, a sensitivity analysis was performed
by considering the subgroup of studies comparing PN to RN
for cT2 only (secondary endpoint).
For continuous outcomes, the weighted mean difference
(WMD) was used as a summary measure, whereas the odds
ratio (OR) or risk ratio (RR) with 95% confidence interval (CI)
was calculated for binary variables. RR was preferred in the
case of a high number of events to avoid overestimation. As
only means and standard deviations are permitted for the
computational portion of meta-analyses, a validated
mathematical model was used to convert median (range)
to mean (standard deviation)
[21]for studies reporting
medians and ranges.
When two publications were reported by the same group
and it was clear that the same data set was used for different
study endpoints, relevant parameters were only counted
once for the scope of the present analysis. This was the case
for the series reported by Roos et al
[22,23]and by Kopp et al
[14,24] .Pooled estimates were calculated using a fixed-effects
model if no significant heterogeneity was identified;
alternatively, a random-effects model was used when
significant heterogeneity was detected. Statistical hetero-
geneity was defined based on the Cochrane
Q p
value or
I
2
statistic. To evaluate publication bias, Egger linear regres-
sion and funnel plots were examined. All statistical analyses
were performed using Review Manager 5 (Cochrane
Collaboration, Oxford, UK).
3.
Evidence synthesis
3.1.
PN versus RN for cT1b and cT2 tumors
Overall, 21 case-control studies including 11 204 patients
(RN 8620; PN 2584) were deemed eligible and included in
the analysis
( Table 1)
[13,22–43] .It is worth noting that
most of the studies were on open surgery, with robotic
surgery used in only one study
[37].
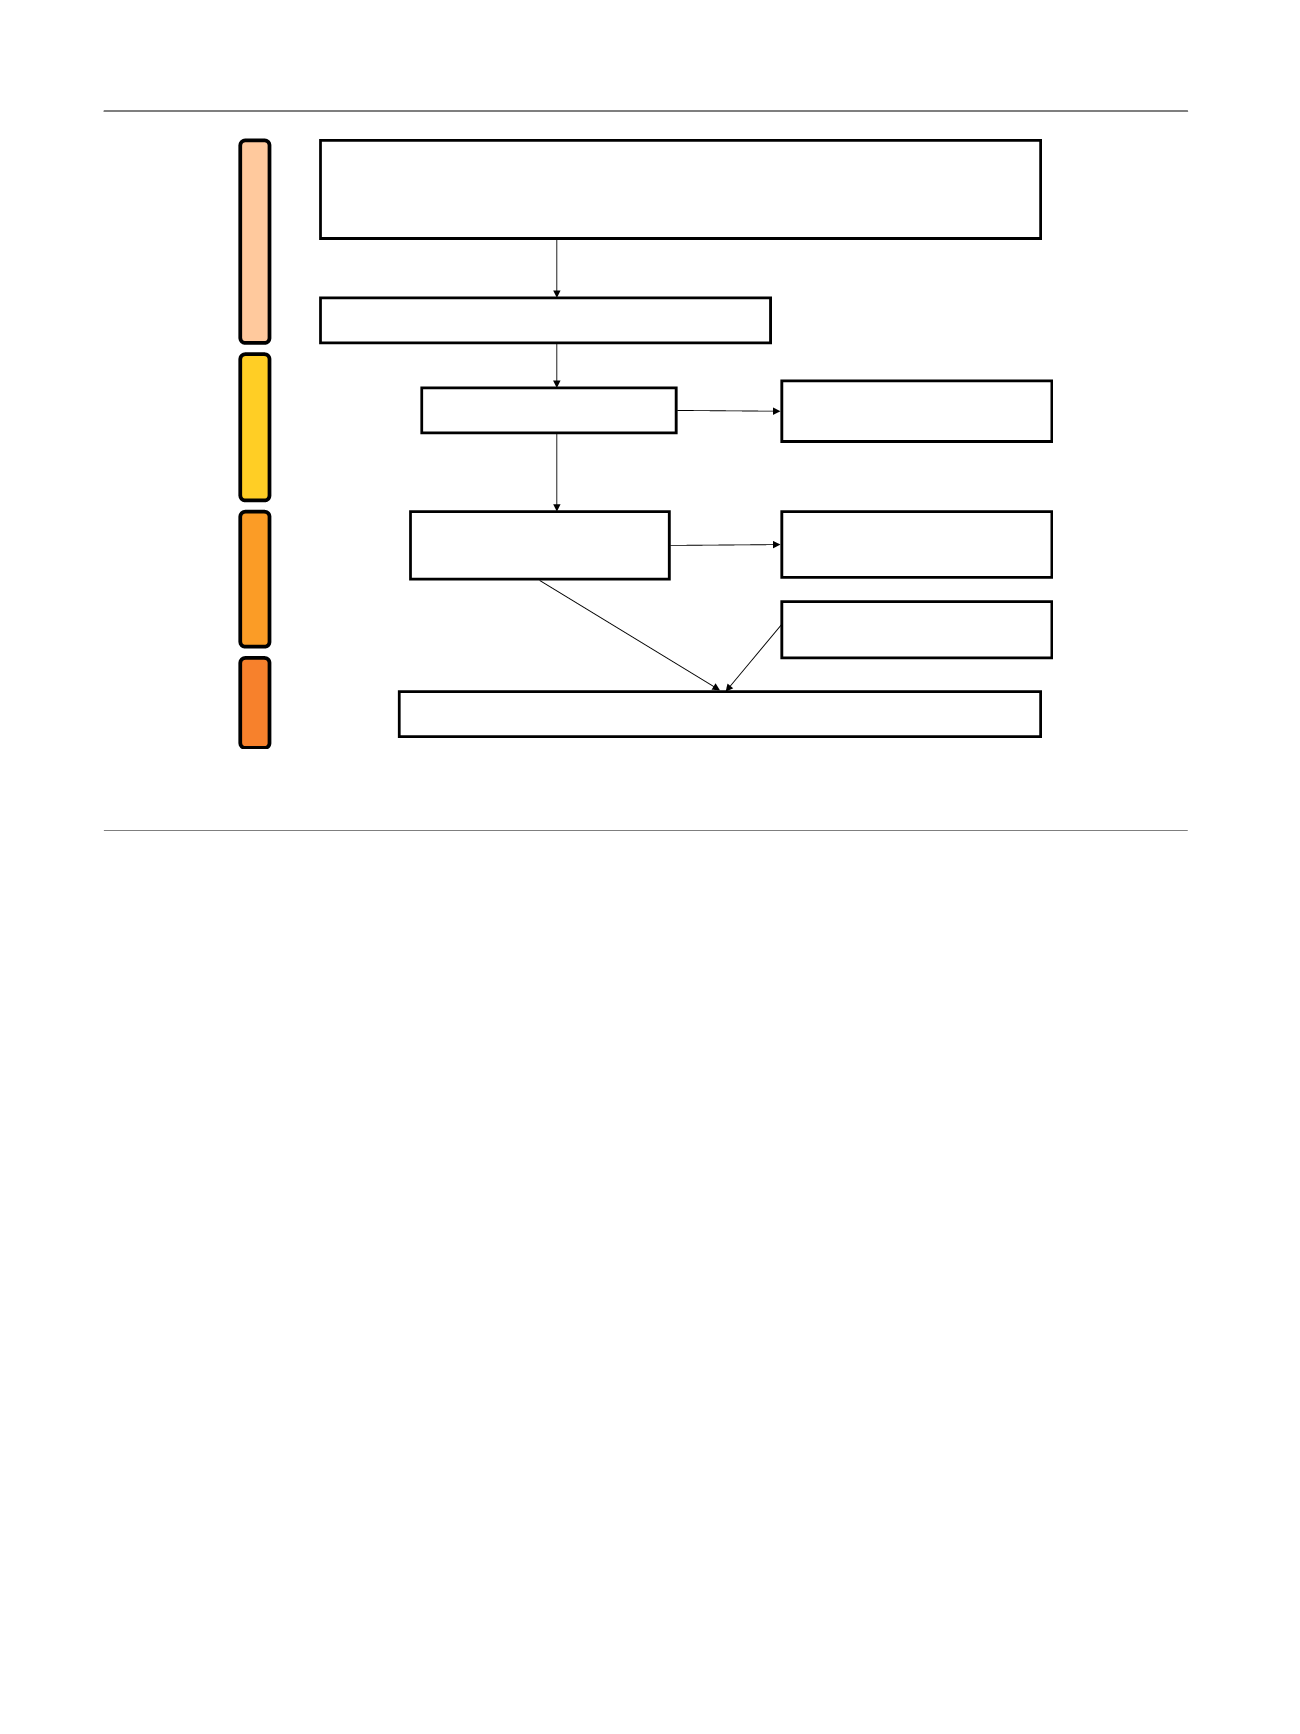
[(Fig._1)TD$FIG]
S
CREENING
I
NCLUDED
E
LIGIBILITY
I
DENTIFICATION
Records screened (
n
= 54)
Records excluded after review of
abstract (
n
= 30)
Full-text articles assessed for
eligibility (
n
= 24)
Full-text articles excluded because of
insufficient data (
n
= 3)
Studies included in the meta-analysis:
n
= 23
a
Additional records identified through
reference lists (
n
= 2)
Records identified through PubMed, Ovid, and Scopus (search up to December 2015) using
keywords for both diagnosis
(renal mass, kidney cancer, renal tumor, 7 cm, 4 cm, T1b, T2)
and
intervention
(partial nephrectomy, radical nephrectomy, nephron sparing surgery)
Records after duplicates removed (
n
= 54)
Fig. 1 – PRISMA flow diagram detailing the search strategy and identification of studies used in data synthesis.
a
Of these 23 studies, in two cases the
same group reported two separate analyses for different endpoints (Roos et al
[20,21]and Kopp et al
[14,23] ;see the text).
E U R O P E A N U R O L O G Y 7 1 ( 2 0 1 7 ) 6 0 6 – 6 1 7
608