


 670 692

remained associated with the risk of death from RCC,
although the HR for each unit increase in SSIGN was
attenuated among M1 patients for each cohort. Finally, the
reduction in risk of death from RCC among contemporary
patients when controlling for SSIGN score remained evident
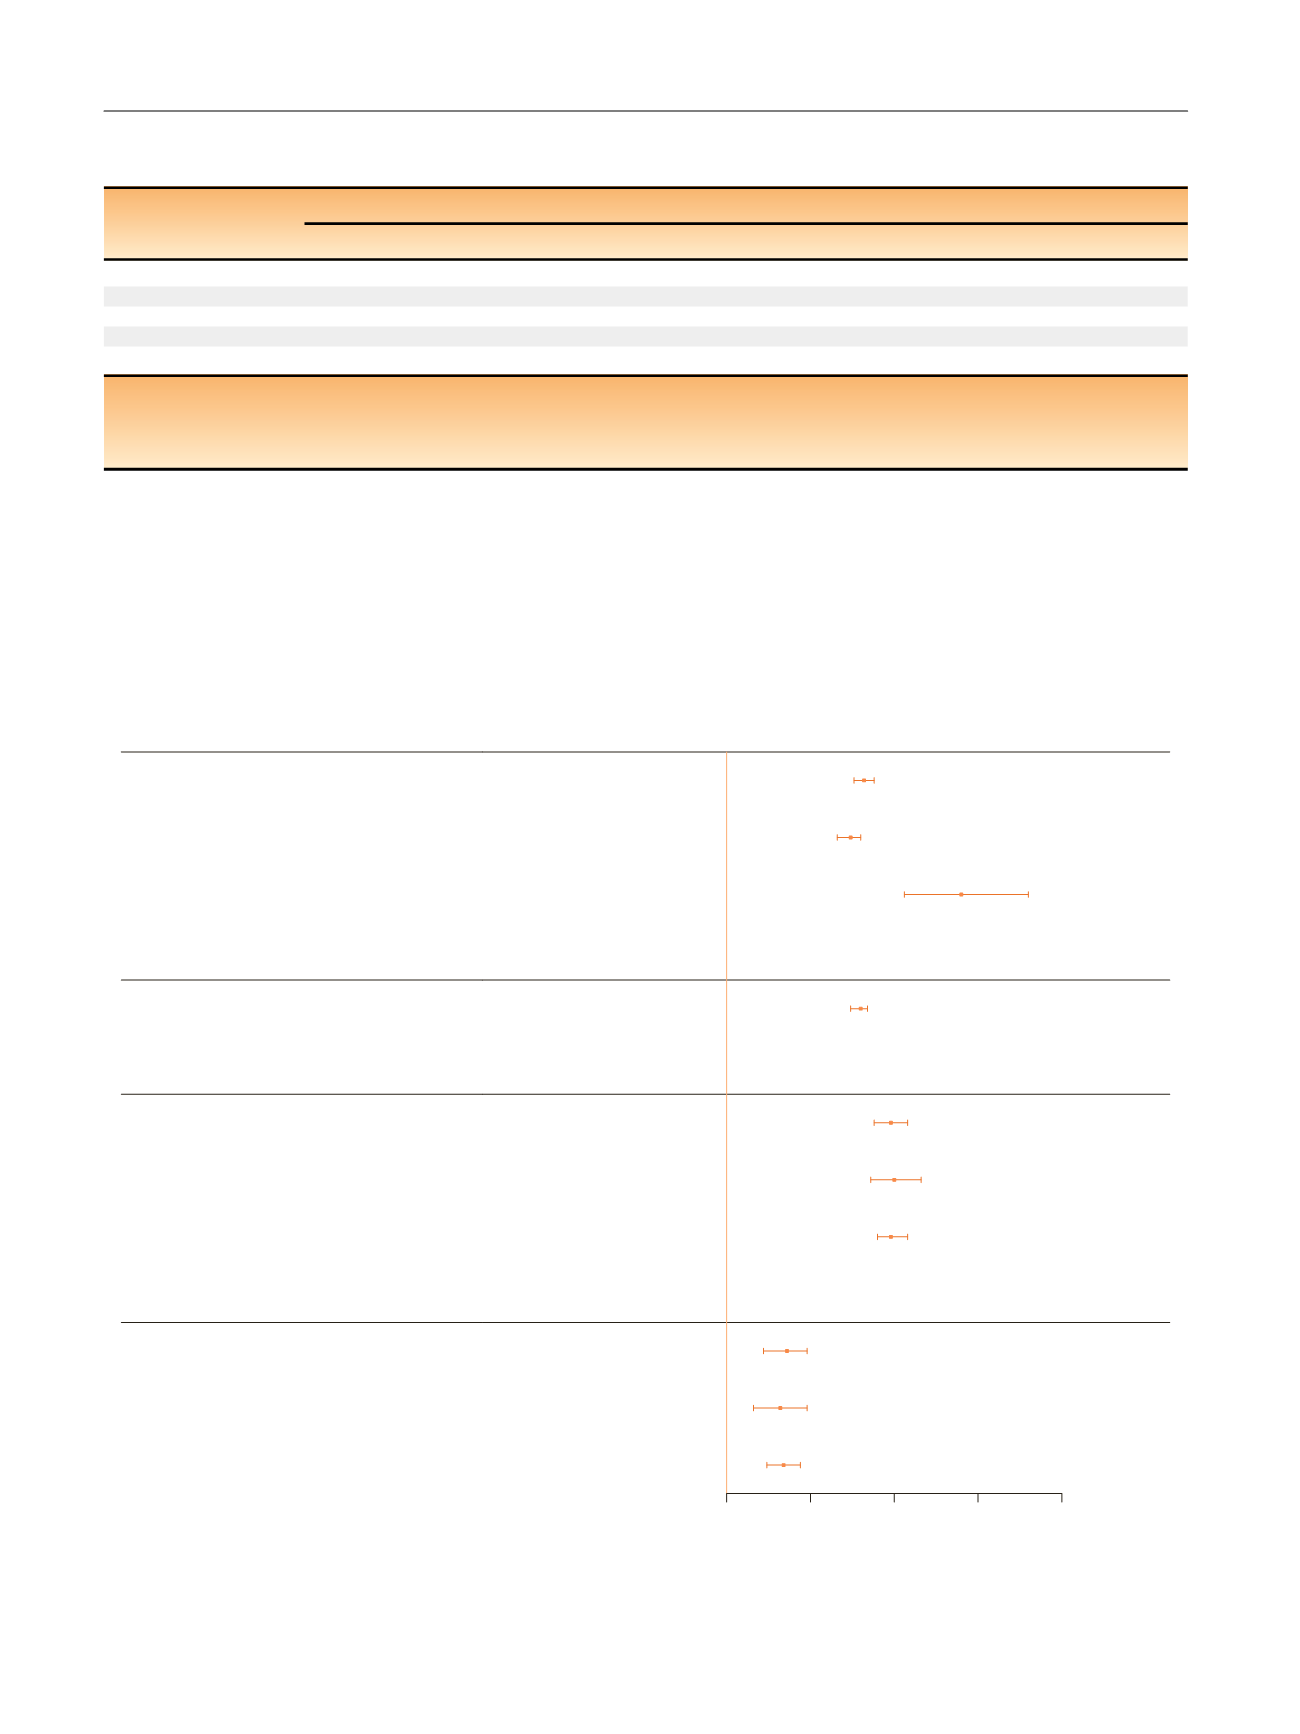
when stratified byM stage (Supplementary Table 2).
Figure 2shows the associations of the SSIGN score with death from
RCC among all cohorts and subgroups.
[(Figure_2)TD$FIG]
SSIGN Score by Cohort
Original RN Cohort
Contemporary RN Cohort
Contemporary PN Cohort
SSIGN Score Controlling for Era of Treatment
Contemporary and Original RN Cohorts
SSIGN Score Among M0 Patients
Original RN Cohort
Contemporary RN Cohort
Contemporary and Original RN Cohorts
SSIGN Score Among M1 Patients
Original RN Cohort
Contemporary RN Cohort
Contemporary and Original RN Cohorts
HR
1.41
1.37
1.70
HR
1.40
HR
1.49
1.50
1.49
HR
1.18
1.16
1.17
95% CI
1.38−1.44
1.33−1.40
1.53−1.90
95% CI
1.37−1.42
95% CI
1.44−1.54
1.43−1.58
1.45−1.54
95% CI
1.11−1.24
1.08−1.24
1.12−1.22
p
value
<0.001
<0.001
<0.001
p
value
<0.001
p
value
<0.001
<0.001
<0.001
p
value
<0.001
<0.001
<0.001
1
1.25
1.5
1.75
2
HR
Figure 2 – Forest plot of hazard ratios (blue boxes) and 95% confidence intervals (blue lines) for the main analyses and as stratified by era of treatment
and M stage.
CI = confidence interval; HR = hazard ratio; PN = partial nephrectomy; RN = radical nephrectomy.
Table 4 – Cancer-specific survival by stage, size, grade, and necrosis (SSIGN) score for patients in the contemporary partial nephrectomy
cohort: observed and competing risk-adjusted rates
Cancer-specific survival rate
s *Score
n
y
Year 1
Year 3
Year 5
Year 7
Year 10
Year 15
0
472
99.8; 99.8 (453)
99.8; 99.8 (431)
99.5; 99.5 (358)
99; 99 (258)
99; 99 (130)
98; 98 (8)
1
131
100; 100 (124)
99; 99 (118)
97; 97 (102)
96; 96 (67)
96; 96 (25)
96; 96 (2)
2
68
100; 100 (64)
98; 98 (61)
98; 98 (46)
98; 98 (24)
98; 98 (11)
NA
3
50
100; 100 (50)
92; 92 (43)
87; 88 (34)
85; 85 (23)
76; 78 (9)
68; 70 (1)
4+
35
94; 94 (31)
85; 86 (27)
75; 77 (21)
69; 71 (10)
69; 71 (5)
NA
NA = Not applicable because no patients were left at risk; RCC = renal cell carcinoma.
*
Two rates are presented. The first is the cancer-specific survival rate estimated using the Kaplan-Meier method; the second is the rate after accounting for the
competing risk of death from non-RCC causes. Number of patients at risk is denoted in parentheses.
y
Total = 756; 11 patients excluded for unknown cause of death.
E U R O P E A N U R O L O G Y 7 1 ( 2 0 1 7 ) 6 6 5 – 6 7 3
670