


 676 692

3.
Results
During the study period, 168 women assessed for SUI at the
five tertiary referral centers and with proven USI who
fulfilled the inclusion criteria had TVT-O implantation.
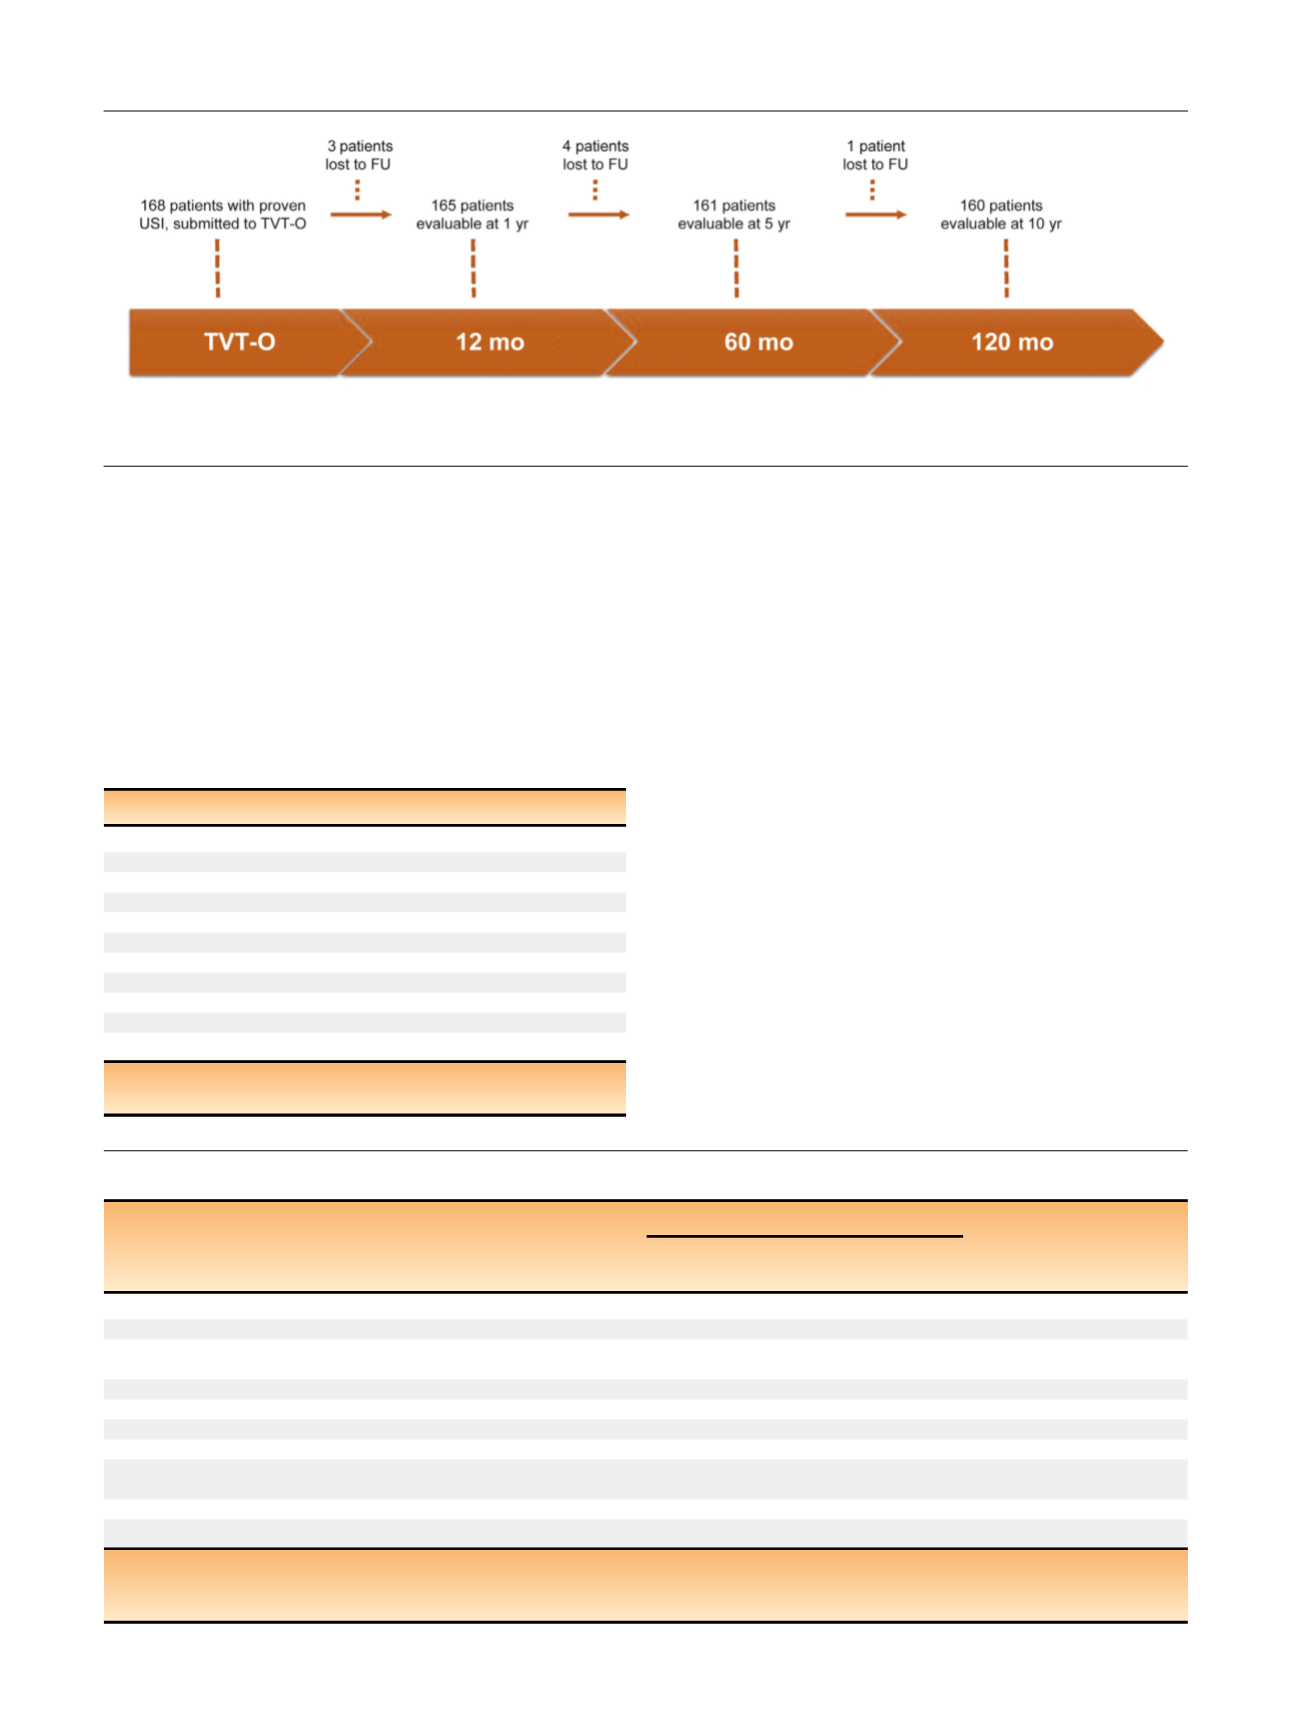
Figure 1displays the study’s flowchart. Baseline character-
istics of the study group are summarized in
Table 1.
At 10-yr follow-up, 160 patients (95%) were available
for the evaluation and eight patients (5%) were lost to
follow-up or were no longer evaluable. Five of these eight
women were subjectively cured at their last evaluation.
Subjective and objective cure rates are summarized in
Table 2 and 3 .These data do not show any significant
change of the surgical outcomes over the follow-up period.
In fact, 10 yr after surgery, 155 of 160 patients (97%)
declared themselves cured (
p
= 0.7). Long-term data
showed similar findings even assuming all missing data
(withdrawals and lost to follow-up) as failures or as cured.
Similar to the subjective outcomes, at the 10-yr evaluation,
148 of 160 women (92%) were objectively cured. No
significant deterioration of objective cure rates was
observed over time (
p
= 0.4). Only two patients required a
second surgical procedure (retropubic sling in both cases).
Table 4reports univariate analysis of factors potentially
involved in the risk of recurrent subjective and objective USI
during the study period. Only previous anti-incontinence
procedures were significantly associated with subjective
recurrent SUI in the univariate analyses (
p
<
0.05).
Table 5summarizes the Clavien-Dindo classification of long-term
or long-lasting complications of TVT-O. The onset of de novo
OAB symptoms was reported by 23 of 160 patients (14%) at
[(Fig._1)TD$FIG]
Fig. 1 – Progress of patients across the study period.
FU = follow-up; TVT-O = tension-free vaginal tape–obturator; USI = urodynamic stress incontinence.
Table 1 – Baseline characteristics
Characteristic
n
= 168
Age, yr, median (IQR)
58 (50–65)
BMI, kg/m
2
, median (IQR)
25.3 (23–28)
Obese, BMI 30, no. (%)
23 (14)
Menopausal, no. (%)
124 (74)
HRT, no. (%)
27 (22)
Smoking habit, no. (%)
76 (45)
Previous vaginal deliveries, median (IQR)
2 (1–2)
Macrosome, 4000 g, no. (%)
48 (25)
Operative delivery, vacuum/forceps, no. (%)
11 (6.5)
Cesarean delivery, no. (%)
23 (14)
Previous POP or anti-incontinence surgery, no. (%)
12 (7.1)
BMI = body mass index; HRT = hormone replacement therapy;
IQR = interquartile range; POP = pelvic organ prolapse.
Table 2 – Cure rates at 12-mo, 5-yr, and 10-yr follow-up visits
Patients, no./total no. (%)
p
value
Cured at
1 yr
Cured at
5 yr
Cured at
10 yr
Objective outcomes
0.4
aWomen with data available at 1, 5, and 10 yr
157/165 (95) 149/161 (91) 148/160 (92) HR: 1.59; 95% CI, 0.63–4.00
0.3
bAssuming all missing data (withdrawals and lost to follow-up) are failures 157/168 (93)
148/168 (88)
Assuming all missing data (withdrawals and lost to follow-up) are cured 160/168 (95)
156/168 (92)
Subjective outcomes
0.
7 aWomen with data available at 1, 5, and 10 yr
157/165 (95) 155/161 (95) 155/160 (97) HR: 0.66; 95% CI, 0.20–1.97
0.
4 bAssuming all missing data (withdrawals and lost to follow-up) are failures 157/168 (93)
155/168 (92)
Assuming all missing data (withdrawals and lost to follow-up) are cured 160/168 (95)
163/168 (97)
CI, confidence interval; HR = hazard ratio.
a
x
2
test.
b
x
2
test for trend.
E U R O P E A N U R O L O G Y 7 1 ( 2 0 1 7 ) 6 7 4 – 6 7 9
676