


 539 692

severity composite scores (1.07 vs 1.76;
p
= 0.06), and pain
at its worst (Item 3; 1.34 vs 1.99;
p
= 0.16) were also lower
with enzalutamide, but differences were not statistically
significant. PMM sensitivity analyses confirmed significant-
ly lower increase in pain interference for enzalutamide
versus bicalutamide and showed significantly lower in-
crease in pain severity with enzalutamide; however, there
was no significant difference for change in pain at its worst.
There was no between-treatment difference in time-to-pain
progression
( Table 3).
4.
Discussion
TERRAIN demonstrated superiority of enzalutamide versus
bicalutamide for the primary endpoint progression-free
survival in patients with mCRPC
[10] .Our results show that
enzalutamide was also associated with better HRQoL versus
bicalutamide in this population of men with mild HRQoL
impairment, not yet burdened by metastatic disease-
related symptoms at enrolment. Enzalutamide appeared
to be associated with better HRQoL on several domains,
likely due to lower rates of symptomatic disease progres-
sion. In the primary analysis, significant differences
favouring enzalutamide were seen at 61 wk in FACT-P
total and FAPSI-8 and EWB domains, with changes in FACT-
P total score exceeding that considered a clinically
meaningful change.
Patients in both arms reported HRQoL deterioration at
some point during the study (except EWB with enzaluta-
mide; MMRM analysis); however, those receiving enzalu-
tamide had significantly lower risk of first deterioration in
EQ-5D index, FACT-P/FACT-G total, and PCS pain-related
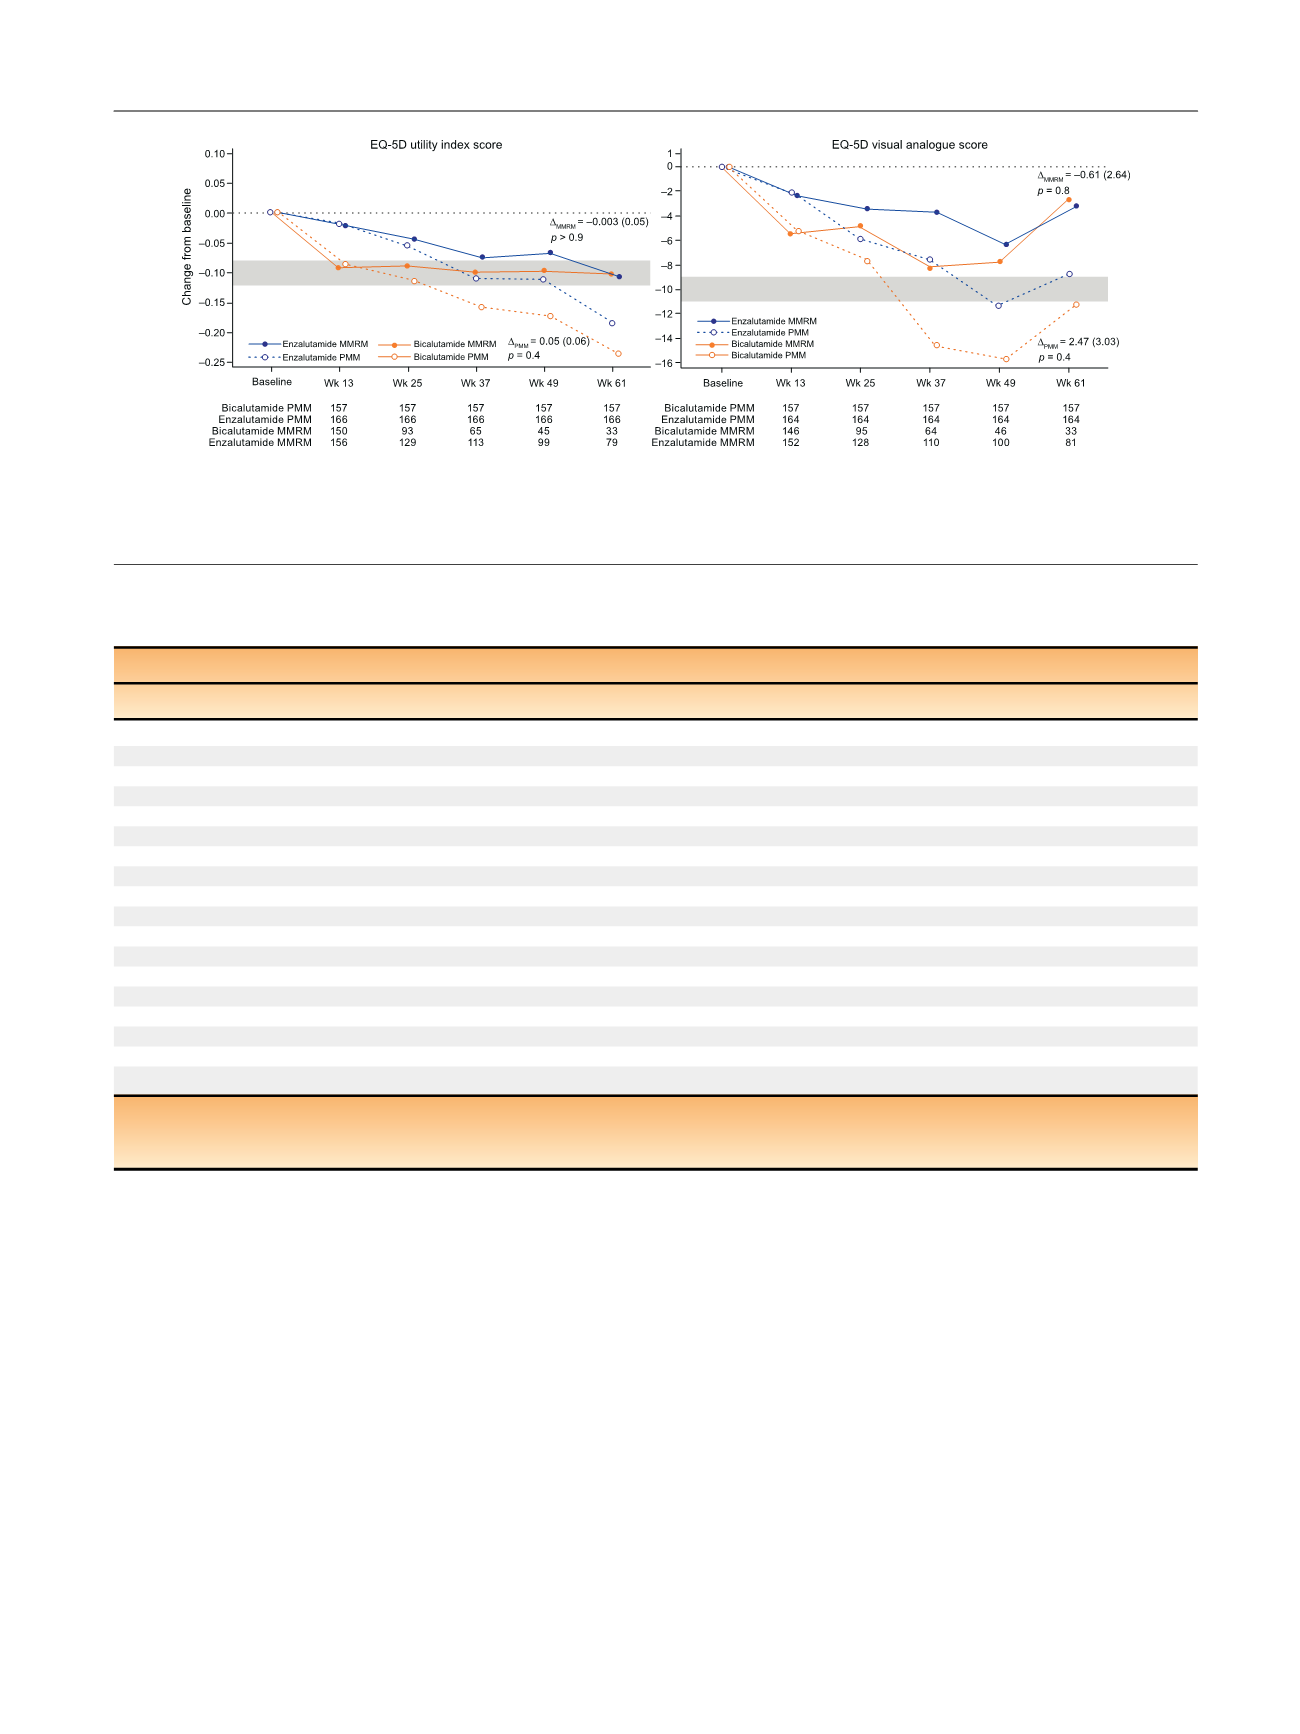
[(Fig._2)TD$FIG]
Fig. 2 – Change in European Quality of Life 5-Domain Scale (EQ-5D) scores over time. The grey bars represent the minimal clinically important
difference range.
D
MMRM
is the adjusted mean (standard error) change from baseline with enzalutamide versus bicalutamide at wk 61 (mixed model
repeated measures [MMRM] analysis).
D
PMM
is the adjusted mean (standard error) change from baseline with enzalutamide versus bicalutamide at wk
61 (pattern mixture model [PMM] analysis).
Table 3 – Time to first health-related quality of life (HRQoL) deterioration
Median (95% CI) time to first HRQoL deterioration, mo
Outcome
Enzalutamide (
n
= 184)
Bicalutamide
(n
= 191)
HR (95% CI)
p
value
FACT-P
Physical well-being
11.1 (8.3–16.6)
11.1 (8.3–24.9)
1.06 (0.77–1.48)
0.7
Functional well-being
11.1 (8.3–13.8)
8.3 (5.6–11.0)
0.75 (0.55–1.03)
0.07
Emotional well-being
22.1 (14.3–NC)
11.1 (9.3–NC)
0.81 (0.56–1.18)
0.3
Social well-being
22.1 (14.1–NC)
11.8 (5.9–NC)
0.76 (0.53–1.09)
0.1
PCS
8.3 (5.6–11.0)
5.7 (5.6–8.3)
0.77 (0.57–1.04)
0.08
PCS pain-related
8.4 (8.3–11.1)
8.3 (5.6–8.5)
0.74 (0.54–1.00)
0.048
FAPSI-8
8.4 (8.3–11.1)
8.3 (5.7–11.1)
0.84 (0.61–1.15)
0.3
Trial Outcome Index
13.8 (8.5–22.0)
11.0 (8.2–13.8)
0.72 (0.52–1.02)
0.061
FACT-G total score
15.7 (11.1–22.5)
9.3 (8.2–11.8)
0.70 (0.50–0.98)
0.04
FACT-P total score
13.8 (11.1–22.0)
8.5 (5.8–11.3)
0.64 (0.46–0.89)
0.007
EQ-5D
EQ-5D utility index
14.3 (8.5–NC)
10.9 (5.8–16.6)
0.66 (0.47–0.93)
0.02
EQ-5D VAS
16.6 (11.3–24.8)
11.3 (8.3–NC)
0.76 (0.53–1.08)
0.1
Median time to pain progression (mo)
Pain at its worst (Item 3 of the BPI)
5.6 (5.6–8.2)
5.6 (3.1–8.3)
0.91 (0.68–1.21)
0.5
Pain severity (mo)
6.0 (5.6–8.3)
5.7 (5.6–8.4)
0.93 (0.70–1.25)
0.6
Pain interference (mo)
11.0 (8.3–14.3)
11.1 (8.3–14.1)
1.01 (0.73–1.40)
0.98
BPI = brief pain inventory; CI = confidence interval; EQ-5D = European Quality of Life 5-Domain Scale; FACT-G = Functional Assessment of Cancer Therapy–
General; FACT-P = Functional Assessment of Cancer Therapy–Prostate; FAPSI-8 = FACT Advanced Prostate Symptom Index-8; HR = hazard ratio;
HRQoL = health-related quality of life; NC = not computed due to the right-censoring in the data; PCS = prostate cancer subscale; VAS = visual analogue scale.
E U R O P E A N U R O L O G Y 7 1 ( 2 0 1 7 ) 5 3 4 – 5 4 2
539