


 658 692

This is the same cutoff used for age subgroup analysis for COU-AA-302
[16]and COU-AA-301
[17]and is consistent with US regulatory guidance
to define a geriatric population in clinical trials
[18] .Clinical progression
data were obtained from investigator reports, and data on responses and
subsequent therapy for mCRPC were collected by trial monitors during
site visits. The data were then source-verified and entered into the
database. PSA response rates and post-treatment PSA declines were
summarized using frequency and percentages. The time to PSA
progression (TTPP) was estimated using PCWG2 criteria and included
censored patients. Median TTPP with 95% CI was estimated using the
Kaplan-Meier method.
3.
Results
Baseline characteristics for patients who progressed on
AA and received docetaxel as FST were similar to the full
COU-AA-302 intention-to-treat (ITT) population
( Table 1).
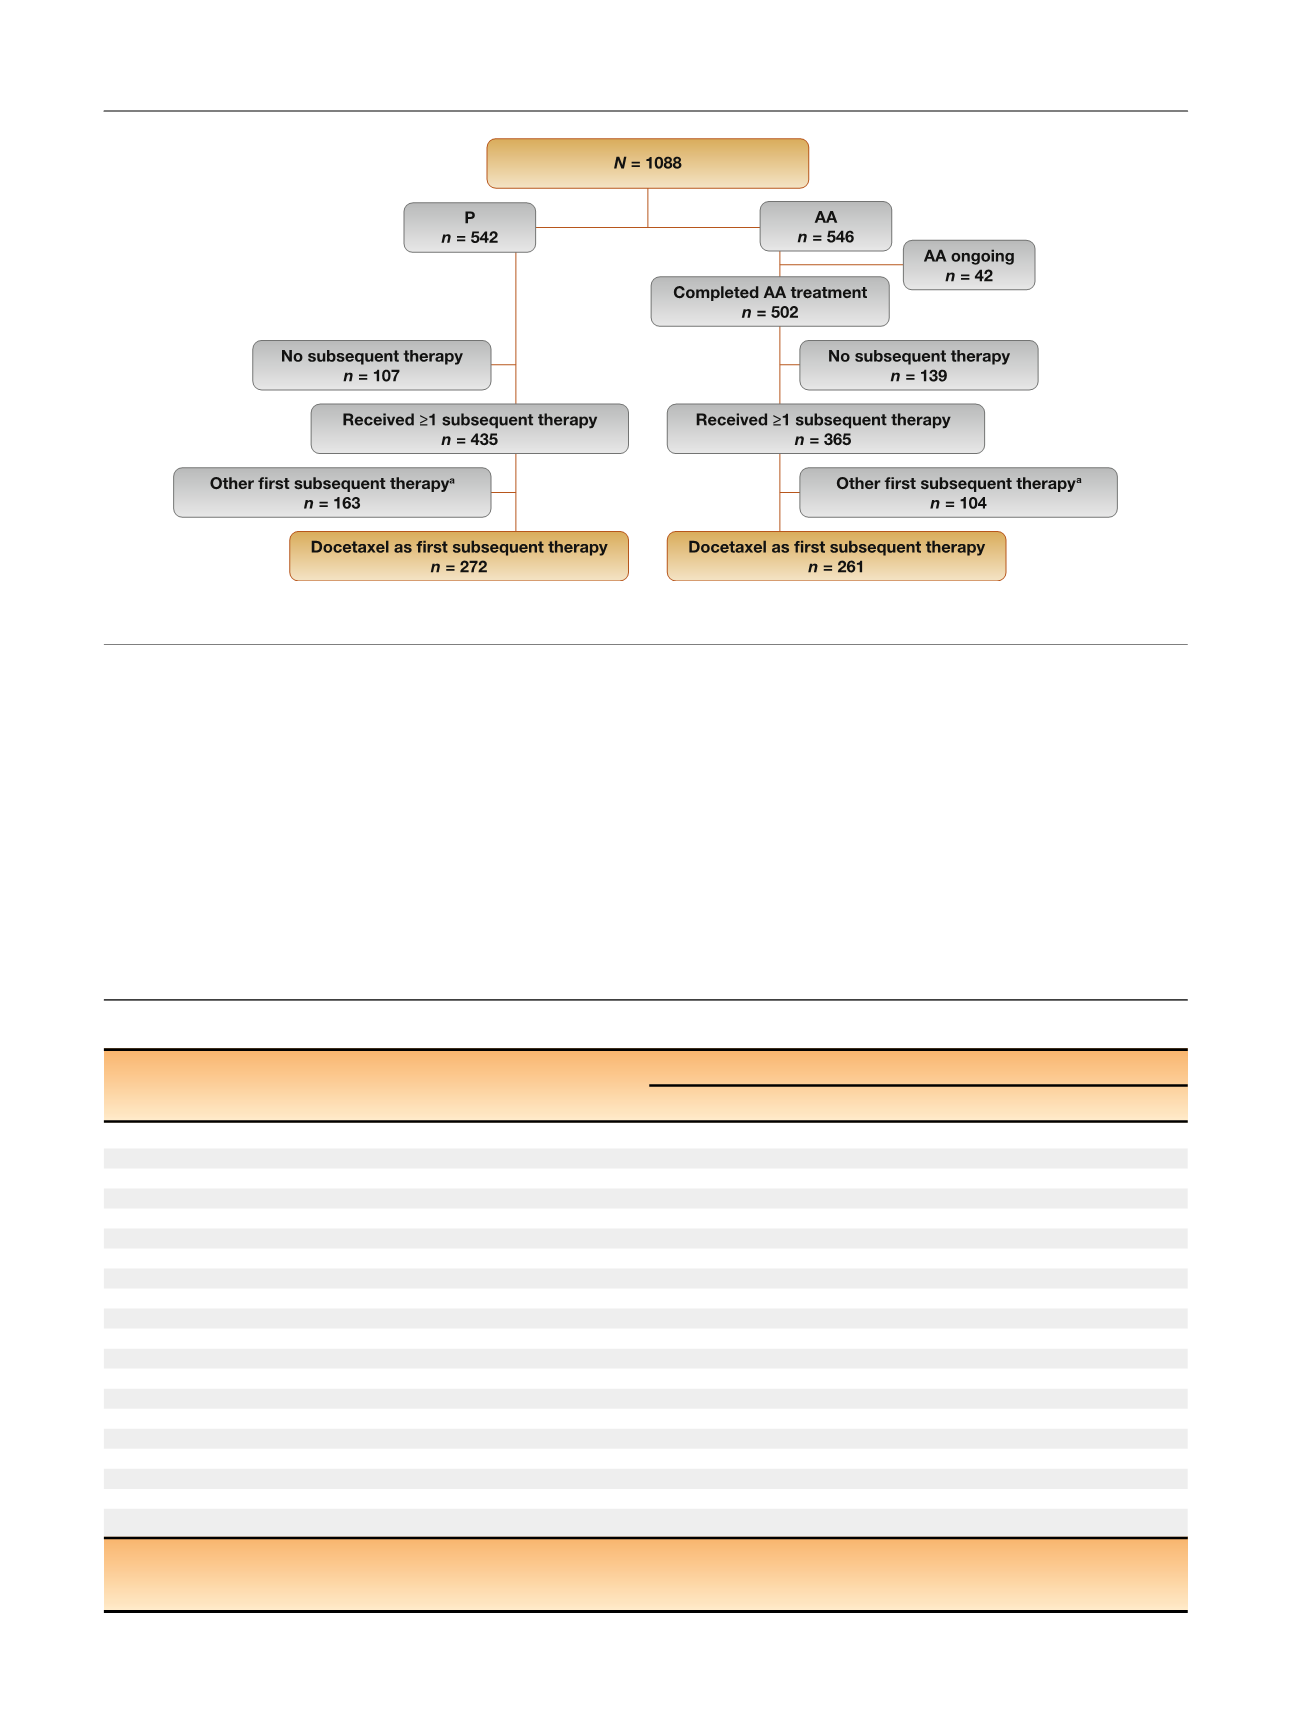
Among patients in the AA arm, 36% (194/546) and 15% (83/
546) had two or more and three or more subsequent
therapies, respectively
( Table 2 ). Among those in the P arm,
45% (243/542) and 22% (121/542) had two or more and
three or more subsequent therapies, respectively.
[(Fig._1)TD$FIG]
Fig. 1 – CONSORT diagram.
a
Abiraterone acetate, cabazitaxel, enzalutamide, ketoconazole, or sipuleucel-T.
Table 1 – Baseline characteristics of the ITT population and patients who received docetaxel as FST
COU-AA-302 AA treatment arm
Docetaxel as FST
ITT population
Patients (
N
)
261
546
Median age, yr (range) [
n
]
69 (44–93) [261]
71 (44–95)
Median time from ID to FD, yr (range) [
n
]
4.4 (
<
1–28) [261]
5.5 (
<
1–28) [542]
Median PSA at ID, ng/ml (range) [
n
]
23 (2–5036) [236]
22 (0.4–5036) [470]
Gleason score 8 at ID,
n
/
N
(%)
129/244 (53)
263/488 (54)
Extent of disease,
n
/
N
(%)
Bone only
132/261 (51)
274/542 (51)
Soft tissue
a or node
128/261 (49)
267/542 (49)
Other
1/261 (
<
1)
4/542 (
<
1)
ECOG PS,
n
/
N
(%)
0
206/261 (79)
423/546 (76)
1
55/261 (21)
133/546 (24)
Prior prostate cancer therapy,
n
/
N
(%)
Surgery
125/261 (48)
256/544 (47)
Radiotherapy
138/261 (53)
283/544 (52)
Hormonal
261/261 (100)
544/544 (100)
Other
39/261 (15)
82/544 (15)
Median baseline PSA, ng/ml (range) [
n
]
48 (1–3266) [261]
42 (0–3927) [546]
Median baseline LDH, IU/l (range) [
n
]
189 (60–871) [261]
187 (60–871) [543]
Median baseline ALP, IU/l (range) [
n
]
103 (32–1927) [261]
93 (32–1927) [546]
ITT = intention to treat; FST = first subsequent therapy; AA = abiraterone acetate plus prednisone; ID = initial diagnosis; FD = first dose; ECOG PS = Eastern
Cooperative Oncology Group performance status; PSA = prostate-specific antigen; LDH = lactate dehydrogenase; ALP = alkaline phosphatase.
a
Excludes visceral metastases.
E U R O P E A N U R O L O G Y 7 1 ( 2 0 1 7 ) 6 5 6 – 6 6 4
658