


 684 692

samples were then thawed and centrifuged at
[5_TD$DIFF]
1900
g
for 15 min to remove cellular debris. Exosome isolation
from plasma was performed using the exoRNeasy kit
(Qiagen, Valencia, CA, USA) on exoEasy spin columns, and
RNA was extracted from the vesicles bound to the silica
membrane using the QIAzol phenol/guanidine-based lysis
solution. Chloroform was then added to QIAzol-samples
and centrifuged at 12 000
g
for 15 min at 4
8
C. The
aqueous phase containing RNA was recovered and applied
to the RNeasy MinElute spin column, in which the
RNA binds to the membrane and contaminants are
discarded. The RNA was finally eluted in 20
m
l of the
elution buffer.
2.4.
Analysis of
[6_TD$DIFF]
AR-V7 on plasma-derived exosomal RNA
The investigational part of this study included the assess-
ment of AR-V7 in CRPC patients. Other mutations of the
androgen-related pathway were not examined because of
the limited amount of RNA available and lack of strong
scientific evidence concerning their role in resistance. The
analysis of AR-V7 in RNA was performed by ddPCR using the
One-Step RT-ddPCR kit, as described earlier. VCaP RNA was
used to spike clinical samples and blank specimens as the
control. Results were reported as copies of mutant allele per
milliliter of plasma.
2.5.
Data analysis
The ddPCR QuantaSoft software determined the absolute
target concentration as copies/ml in the samples. Statisti-
cal analyses were performed separately in the AR-V7-
positive (AR-V7
+
[5_TD$DIFF]
) and AR-V7-negative (AR-V7 ) cohorts.
PSA response rates (RRs) were compared with the Fisher
exact test. Time-to-event outcomes (ie, clinical or radio-
graphic progression-free survival [PFS] and overall surviv-
al [OS]) were evaluated by the Kaplan-Meier method, and
survival-time differences were compared by the log-rank
test. Additional statistics were performed by paired
t
test.
All tests were two sided, and
p
values 0.05 were
considered statistically significant. The performance of
the test was assessed by the performance of a binary
classifier system because its discrimination threshold is
varied. The receiver operating characteristic curve (ROC
curve) was created by plotting the true-positive rate
against the false-positive rate at various threshold
settings. SPSS software v2.0 (IBM Corp., Armonk, NY,
USA) was used for calculations.
3.
Results
Using ddPCR we were able to detect the AR-V7 transcript,
even at low concentrations (ie, 2 copies/ml) (Supplementa-
ry Fig. 1). No AR-V7 signal was detected in the unspiked
control plasma or in blank wells, confirming the specificity
of the assay. Supplementary
Table 1reports the median
number of copies spiked per unit volume of plasma and
measured by ddPCR, 95% confidence intervals (CIs), and
coefficients of variation.
3.1.
Patient characteristics and AR-V7 expression
Overall, 36 patients were enrolled, of whom 26 received
abiraterone and 10 enzalutamide; median follow-up time
was 9 mo (range: 2.0–31.0). Baseline characteristics for the
study population are reported in
Table 1 .A total of 14 of
36 patients (38.8%) were AR-V7
+
(100–2400 copies)
( Fig. 1)
before the start of HT. Seven of 14 AR-V7
+
patients had a
plasma sample at baseline (median: 500 copies/ml) and at
progression (median: 887 copies/ml); although there was an
increase, the difference was not statistically significant
(paired
t
test,
p
= 0.25)
( Table 2 ). The AR-FL was
[7_TD$DIFF]
used as an
internal control to validate the extraction process; AR-V7
samples were true negative because the AR-FL signal was
detectable. The starting volume of plasma samples (1 vs 2 ml)
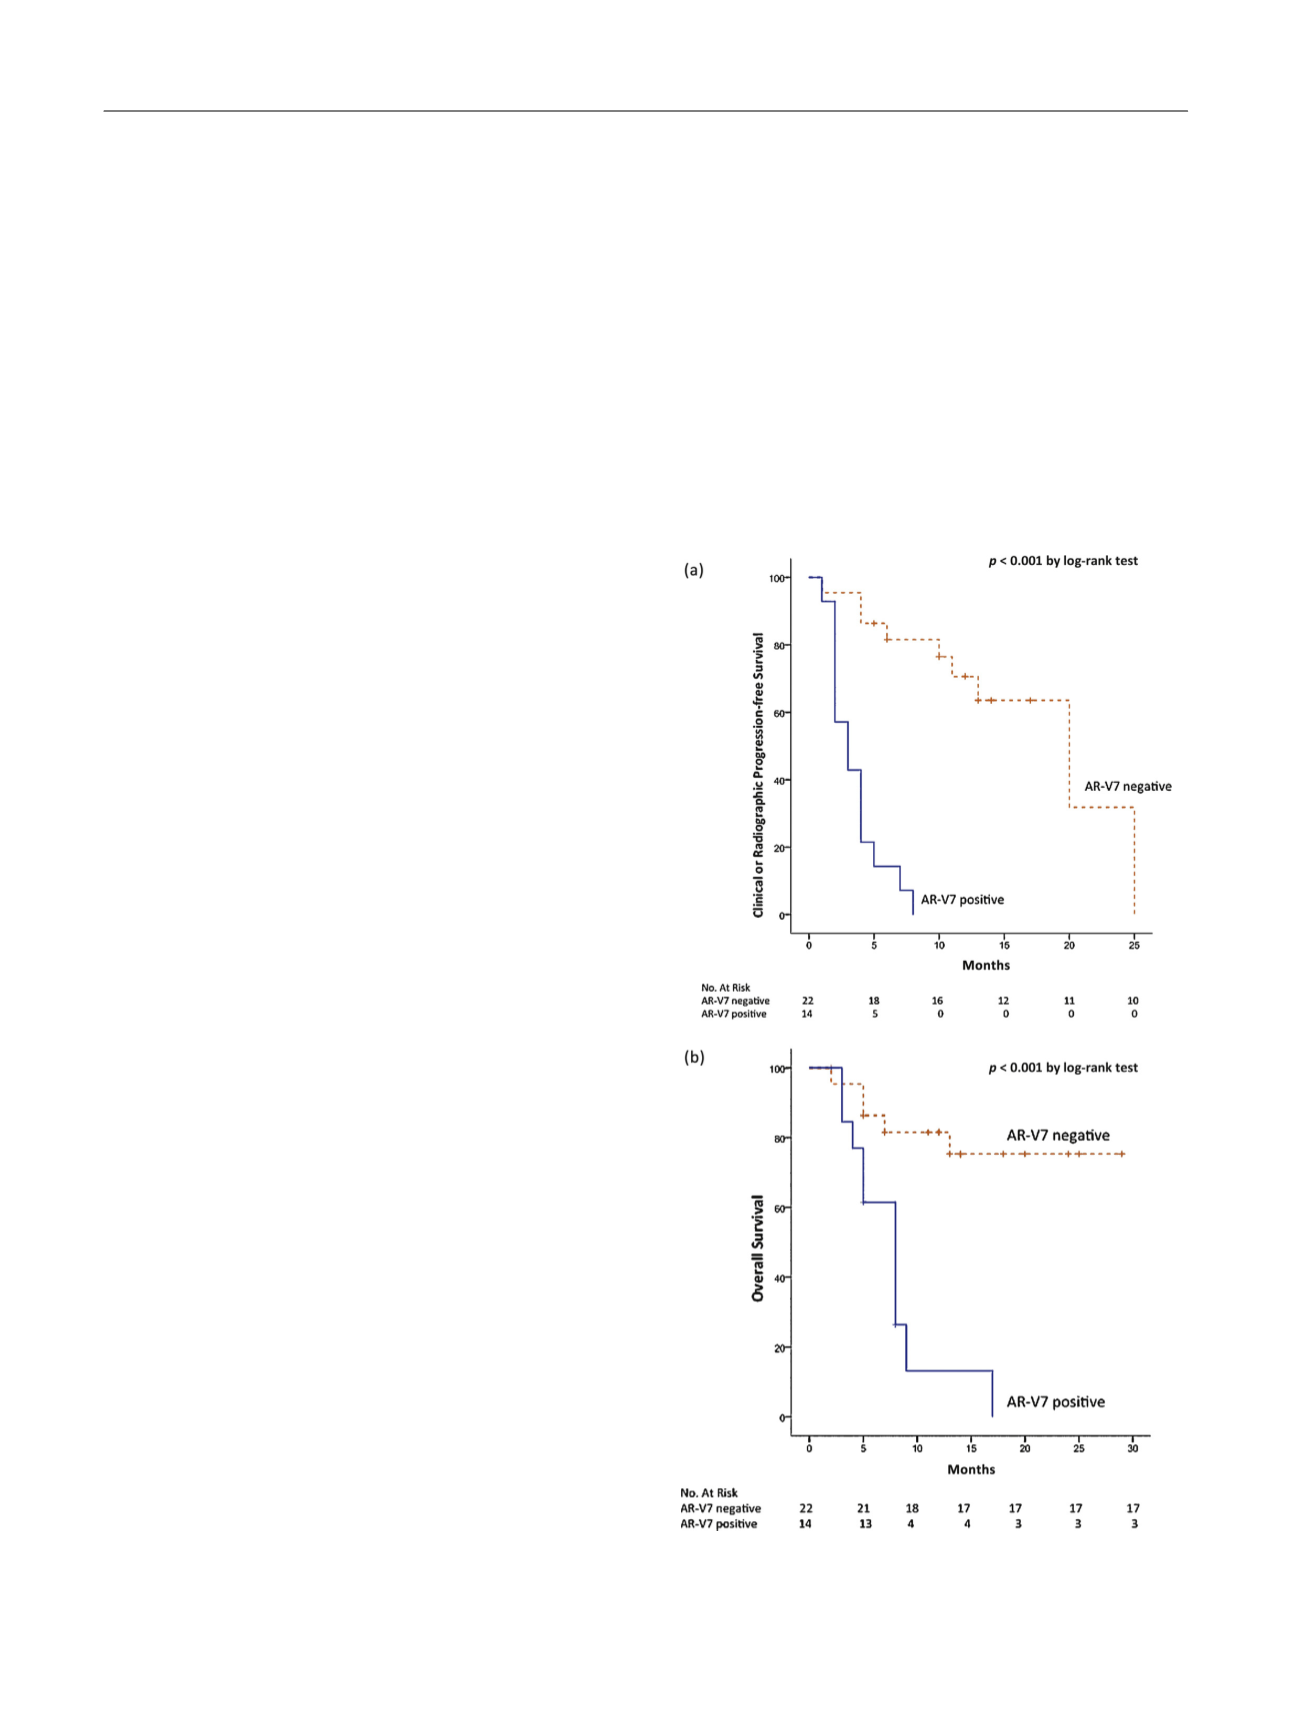
[(Fig._2)TD$FIG]
Fig. 2 – (a) Progression-free survival of androgen receptor splice variant
7–positive (AR-V7
+
) versus AR-V7-negative (AR-V7
S
) patients; (b) overall
survival of AR-V7
+
versus AR-V7
S
patients.
AR-V7 = androgen receptor splice variant 7.
E U R O P E A N U R O L O G Y 7 1 ( 2 0 1 7 ) 6 8 0 – 6 8 7
684