


 685 692

did not significantly affect the ratio of total versus positive
droplets. The median number of total droplets generated was
11 000. The ROC curve is reported in
Figure 1; with the curve
very close to the upper left corner, the overall accuracy of the
test was very high.
3.2.
Clinical outcomes according to the AR-V7 analysis
Table 1reports the characteristics of patients and their AR-
V7 status. The median clinic or radiographic PFS was
significantly longer (20 mo) in AR-V7 patients compared
with AR-V7
+
patients (3 mo; 95% CI, 1.526–14.474;
p
<
0.001 log-rank test)
( Fig. 2 a). The OS was shorter in
AR-V7
+
patients at baseline compared with AR-V7 patients
(median 8 mo vs not reached) (95% CI, 3.751–30.285;
p
<
0.001 log-rank test)
( Fig. 2b), making AR-V7 detection in
exosomes a valuable marker of resistance to HT. The overall
proportion of patients who achieved a PSA response during
HT was 42% (15 of 36). In the AR-V7
+
patients, the PSA RR
was 7% (1 of 14 men); in the AR-V7 patients, the RR was
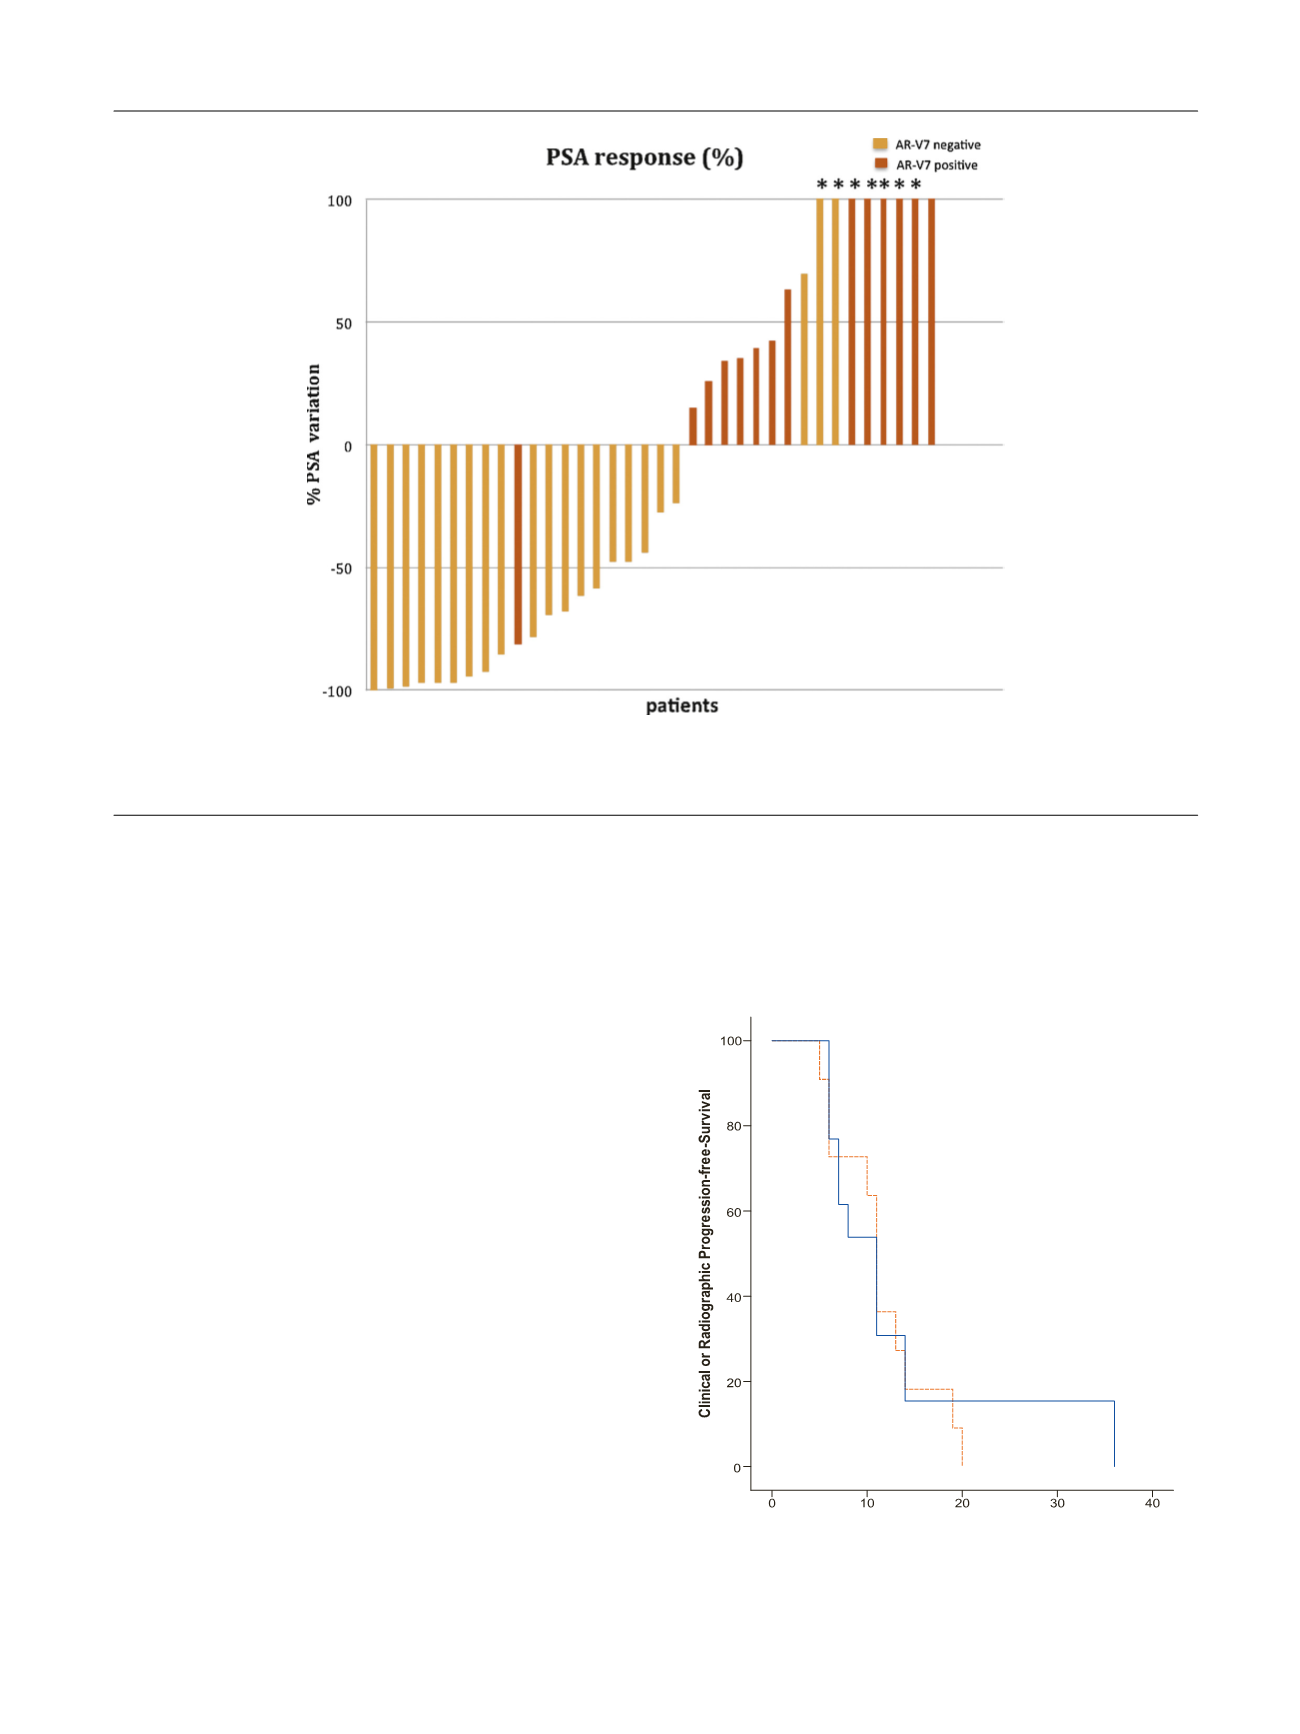
64% (14 of 22 men). PSA responses are shown in
Figure 3. The AR-V7
+
participants were more likely to be
younger, with a Gleason score of at least 8, visceral
metastases, higher PSA levels, and prior docetaxel treat-
ment than AR-V7 patients. Twenty-six of 36 patients were
treated with taxanes before HT, of whom 11 patients were
AR-V7 and 13 were AR-V7
+
. Clinical or radiographic PFS
did not differ significantly depending on AR-V7 status.
Median PFS was 11 mo in AR-V7
+
patients (95% CI, 7.3–14.3
mo,
p
= 0.6) and 11 mo in AR-V7 patients (95% CI, 9.9–12.0
mo,
p
= 0.6)
( Fig. 4 ). Univariate and multivariable Cox
proportional hazard ratios were used to assess the effect of
AR-V7 status on the prediction of time-to-event outcomes.
In the univariate model, we analyzed known risk factors for
[(Fig._3)TD$FIG]
Fig. 3 – Waterfall plot depicting prostate-specific antigen (PSA) responses, according to androgen receptor splice variant 7 status. The dotted line shows
the threshold for defining a PSA response (
I
50% reduction in PSA level from baseline). Asterisks indicate an increase of >100% in PSA response.
AR-V7 = androgen receptor splice variant 7; PSA = prostate-specific antigen.
[(Fig._4)TD$FIG]
AR-V7 negaƟve
Months
AR-V7 posiƟve
p
= 0.6 by log-rank test
Fig. 4 – Kaplan-Meier curves showing clinical and/or radiographic
progression-free survival in taxane-treated patients, according to
androgen receptor splice variant 7 status.
AR-V7 = androgen receptor splice variant 7.
E U R O P E A N U R O L O G Y 7 1 ( 2 0 1 7 ) 6 8 0 – 6 8 7
685