


 683 692

[(Fig._1)TD$FIG]
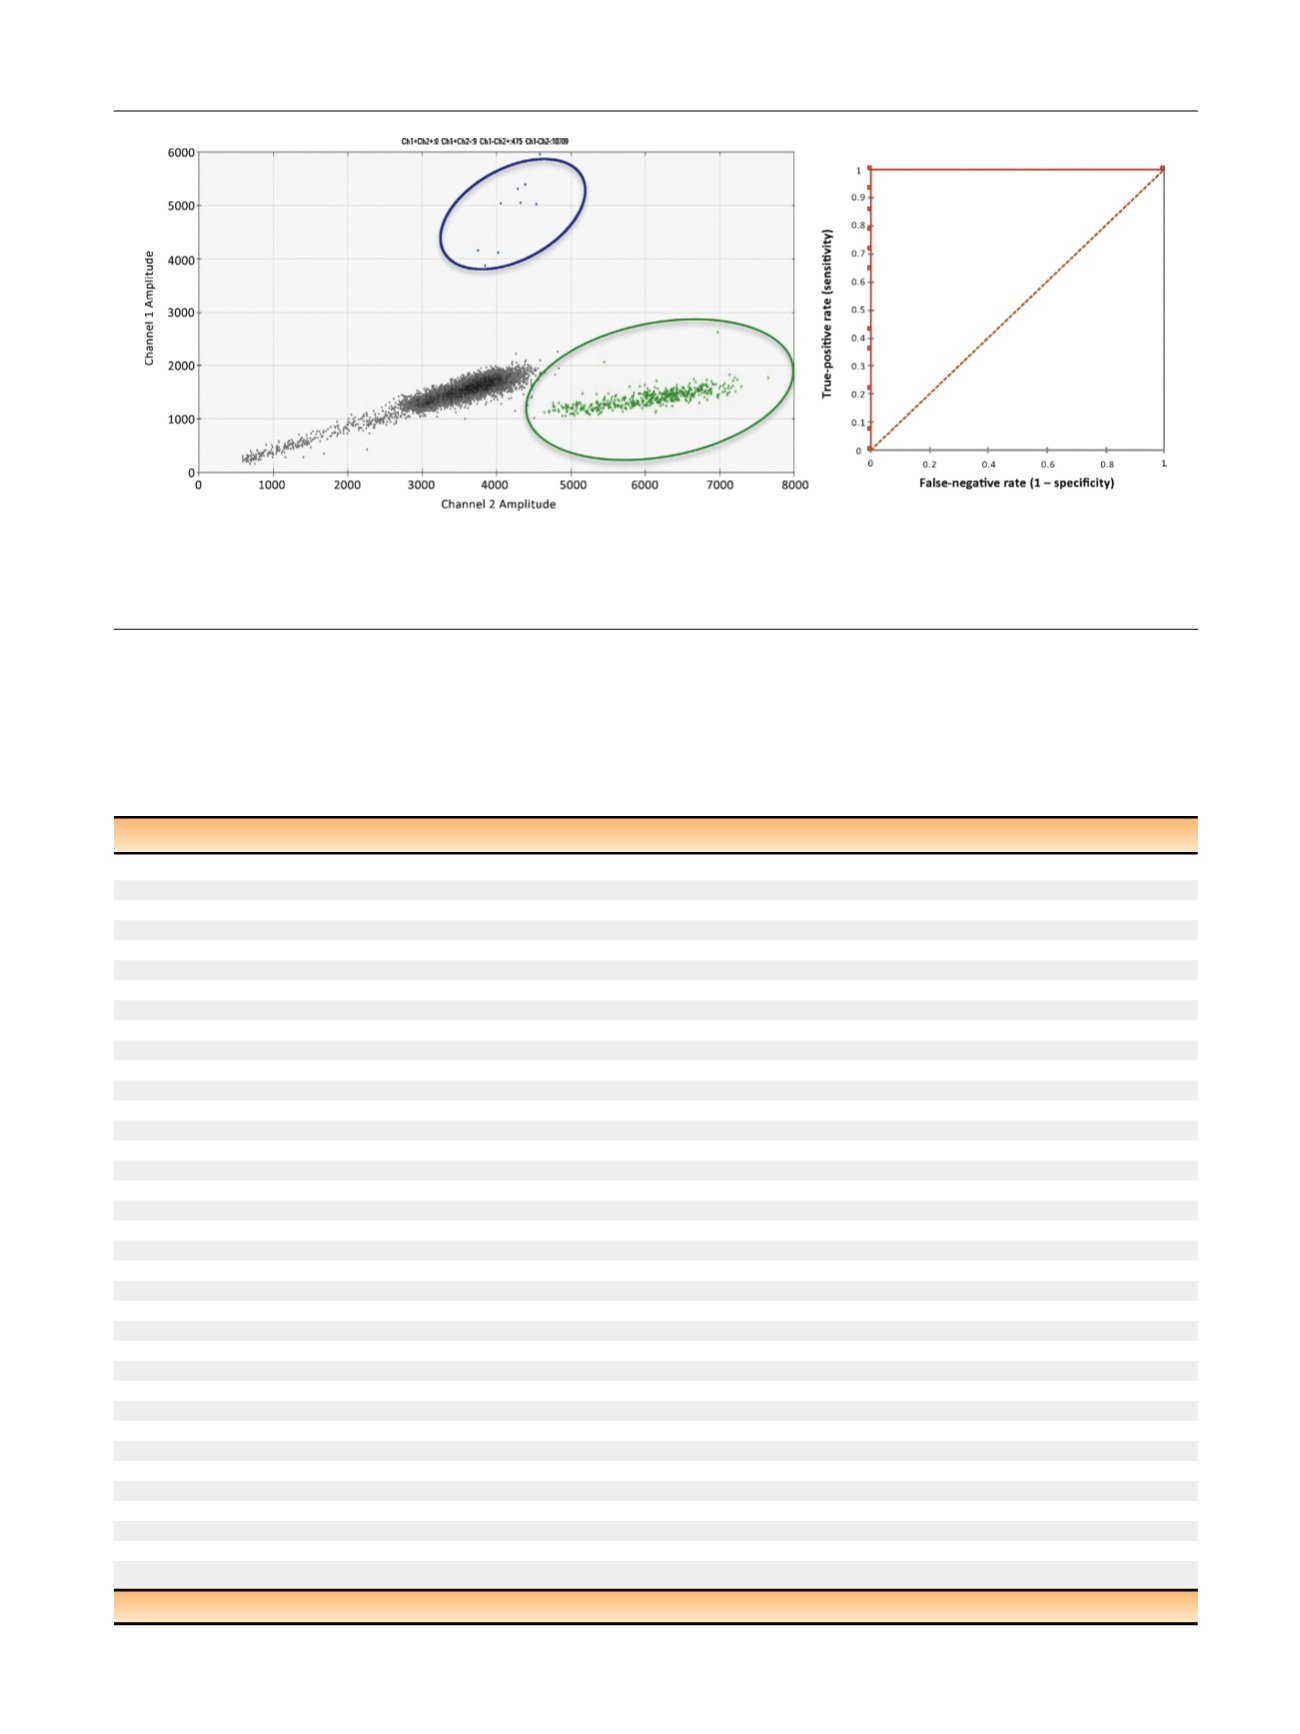
Fig. 1 – Androgen receptor splice variant 7 (AR-V7) amplification by digital droplet polymerase chain reaction. The blue dots represent positives
droplets for the AR-V7 amplification. The green dots represent positive droplets for the AR wild-type amplification. The gray dots are empty droplets
or droplets containing primers dimers. The insert represents the receiver operating characteristic curve generated by the data of the present study.
AR-V7 = androgen receptor splice variant 7; ddPCR = digital droplet polymerase chain reaction.
Table 2 – Fractional abundance (percentage) and numbers of copies per milliliter in androgen receptor splice variant 7 samples
Sample
Baseline AR-V7, %
Baseline AR-V7, copies/ml
PD AR-V7, %
PD AR-V7, copies/ml
1
3.4
360
NA
NA
2
5.4
390
NA
NA
3
6.5
530
NA
NA
4
2.1
100
NA
NA
7
6
600
3
410
9
8
700
3.5
600
10
8
500
3
500
11
6
500
4.1
1200
12
2.2
300
8
2400
13
10
600
NA
NA
14
5
500
6
600
15
8
700
NA
NA
16
2.8
400
3
500
17
1.8
900
NA
NA
5
0
0
NA
NA
6
0
0
NA
NA
8
0
0
NA
NA
18
0
0
NA
NA
19
0
0
NA
NA
20
0
0
NA
NA
21
0
0
NA
NA
22
0
0
NA
NA
23
0
0
NA
NA
24
0
0
NA
NA
25
0
0
NA
NA
26
0
0
NA
NA
27
0
0
NA
NA
28
0
0
NA
NA
29
0
0
NA
NA
30
0
0
NA
NA
31
0
0
NA
NA
32
0
0
NA
NA
33
0
0
NA
NA
34
0
0
NA
NA
35
0
0
NA
NA
36
0
0
NA
NA
AR-V7 = androgen receptor splice variant 7; copies/ml = copies per milliliter; NA = not available; PD = progression of disease.
E U R O P E A N U R O L O G Y 7 1 ( 2 0 1 7 ) 6 8 0 – 6 8 7
683