


 512 692

The Prostate Cancer Intervention Versus Observation Trial
(PIVOT) found that radical prostatectomy (RP) offered no
survival benefit compared with observation in men with
clinically localized prostate cancer (PCa)
[1] .However, the
men enrolled in PIVOT may not be truly representative of
North American patients with newly diagnosed PCa
[2,3],
and that may compromise the external validity of PIVOT
results in the contemporary US health care system. In an
effort to further ascertain this, we studied the character-
istics of PCa patients treated with RP or observation within
the National Cancer Database (NCDB) during the period
2004–
[1_TD$DIFF]
2012.
[2_TD$DIFF]
NCDB is a nationwide hospital-based cancer
registry is jointly supported by the American College of
Surgeons and the American Cancer Society
[4].
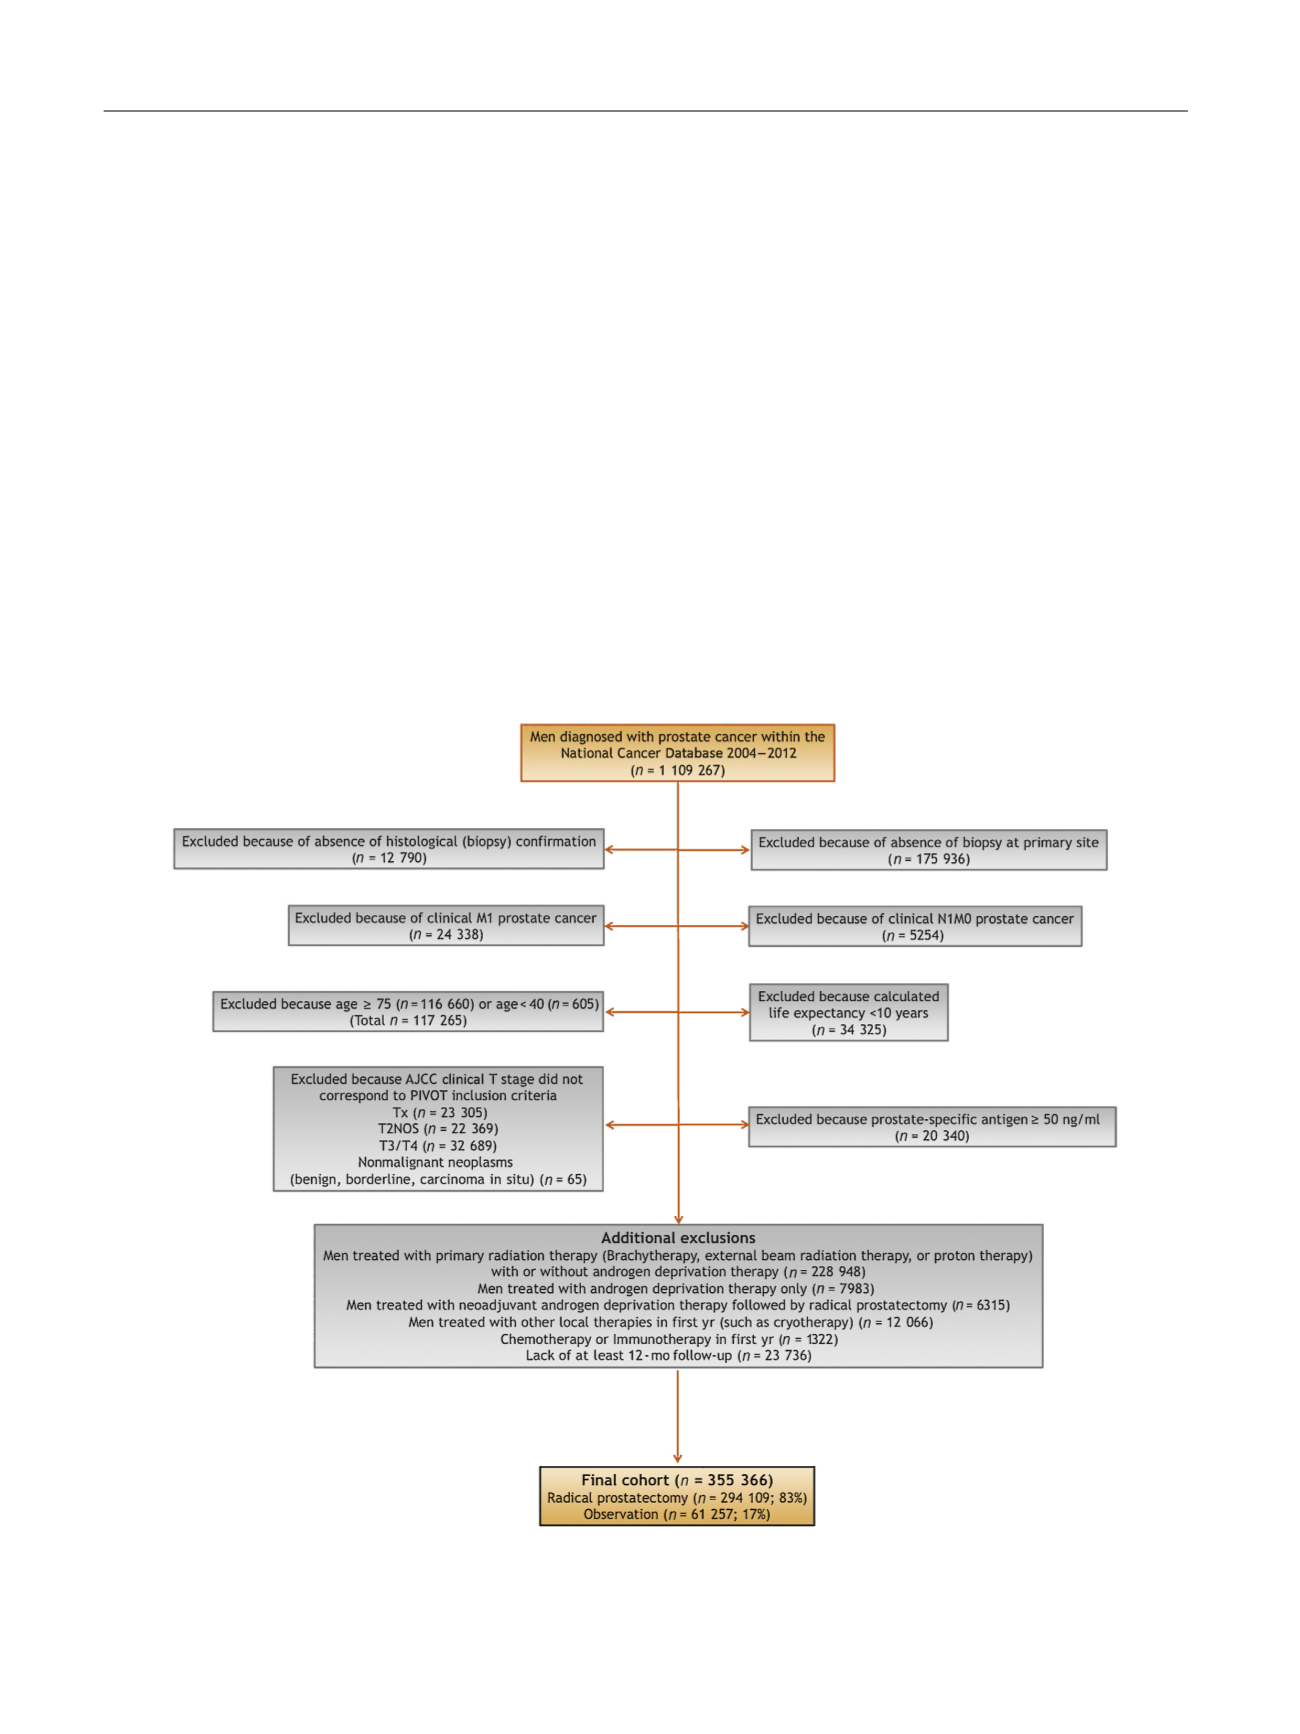
We identified men residing in the 50 United States or the
District of Columbia within the NCDB for 2004–2012 who
met the inclusion criteria of PIVOT—histologically con-
firmed PCa, clinical stage T1–2NxM0, prostate-specific
antigen (PSA)
<
50 ng/ml, age
<
75 yr, estimated life
expectancy
>
10 yr, and undergoing RP or observation
as initial treatment within 12 mo of diagnosis—and who
had at least 12-mo follow-up. The following demographic
and tumor characteristics of these men were then compared
with participants enrolled in PIVOT: age (40–59, 50–59,
60–69, or 70–75 yr), race (non-Hispanic white, non-Hispanic
black, or other), Charlson-Deyo comorbidity index (CCI; 0, 1,
or
>
1), PSA (
<
4, 4–10, 10.1–19.9, or 20–49.9 ng/ml), clinical
T stage (T1a, T1b, T1c, T2a, T2b, or T2c, based on the
American Joint Committee on Cancer’s AJCC Cancer Staging
Manual, sixth edition), total Gleason score on prostate
biopsy (
<
6, 7, or 8–10), and D’Amico risk group
[5] .Average
life expectancy was calculated using the US Social Security
Administration life tables
( http://www.ssa.gov/OACT/ STATS/table4c6.html )and adjusted for comorbidities at
diagnosis, according to the National Comprehensive
Cancer Network 2015 guidelines. For our analyses, those
with a CCI 1 had their life expectancy halved because we
considered those participants to fall into the lowest
quartile, indicating worst health. Those with a CCI of
0 did not have any change in their life expectancy. We were
unable to calculate who was in the quartile of ‘‘best’’ health
because
>
75% of participants had a CCI of 0. Consequently,
to account for the likely selection bias toward inclusion of
healthy men in our analyses, we conducted an additional
[(Fig._1)TD$FIG]
Fig. 1 – Stepwise selection criteria describing the final cohort of men diagnosed with prostate cancer and treated with radical prostatectomy or
observation within the National Cancer Database (NCDB) during the period 2004–2012 (men within the NCDB were selected to approximate the
inclusion criteria of the Prostate Cancer Intervention Versus Observation Trial).
AJCC = American Joint Committee on Cancer; PIVOT = Prostate Cancer Intervention Versus Observation Trial.
E U R O P E A N U R O L O G Y 7 1 ( 2 0 1 7 ) 5 1 1 – 5 1 4
512